Dashboard: what is it and how to use it in analytics?


Companies receive data from CRM systems, advertising accounts, Google Analytics 4, Excel, 1C, financial systems, and internal databases. When multiple sources are involved, managers or analysts must spend time reconciling figures, finding the required period, and preparing separate reports.
The dashboard gathers key metrics on a single screen and presents them clearly. Users can see changes in sales, expenses, conversions, or other KPIs and quickly drill down from the overall picture to a specific period, channel, or department.
What is a dashboard in simple terms?
A dashboard is an information panel that presents metrics through numbers, tables, graphs, charts, and other data visualization elements. The word “dashboard” is translated as “instrument panel”, so its operation is similar to a car dashboard: a user can see several important parameters at a glance.
In simple terms, a dashboard is a screen with key information on a selected task. A manager can see revenue and plan fulfillment, a marketer can see advertising expenses and cost per lead, and a sales manager can see deals, conversion rates, and average order value.
Dashboards can receive data automatically or be updated manually. The composition of the metrics depends on who is running the analytics and the decisions they have to make.
How is a dashboard different from a regular report?
A standard report often displays data for a predetermined period and stores it in a fixed format. For example, an employee downloads monthly metrics into Excel, creates a spreadsheet, and sends the file to their manager.
Interactive dashboards work differently. Users can change the period, select a traffic source, open a specific region, or view metrics for a specific department without creating a new file.
| Criterion | Dashboard | A regular report |
|---|---|---|
| Update | Scheduled, automatic or manual | Often prepared separately for each period |
| Interactivity | There are filters and detailing | Data is usually fixed |
| Sources | It is possible to connect several systems | Often a single export is used |
| Periods | The user can change the range | The period is set during preparation |
| The main task | Current monitoring and data analysis | Recording and transmitting results |
Standard reports retain their usefulness where a fixed format or a fixed data slice is needed. Dashboards are more convenient for regular analysis, when metrics need to be checked daily or several times a month.
Answers to your questions
What is a dashboard in simple terms?
A dashboard is a screen that displays key metrics for a specific task. The data is presented through numbers, tables, graphs, and charts to help users quickly understand the current status.
Compared to a regular spreadsheet, the main difference of a dashboard is its structure and ease of analysis. Users can see key changes without constantly searching through different sheets and systems for information.
How is a dashboard different from a report?
A report typically captures results for a specific period, and an interactive dashboard can be customized using filters and date selection. Furthermore, data can be updated automatically.
However, the formats are not mutually exclusive. For official reporting, a fixed document is more convenient, while for daily monitoring, an interactive dashboard is more often used.
What types of dashboards are there?
Most commonly, operational, analytical, and strategic dashboards are distinguished. Management dashboards, financial dashboards, sales dashboards, and marketing reports are also used separately.
The specific classification depends on the company and the users' tasks. A single screen can simultaneously contain elements of several types if the workflow justifies it.
How to create a dashboard?
First, you need to define the user and the questions the dashboard should answer. Then, select the KPIs, data sources, software, and visualization structure.
After development, it's necessary to verify the figures against the source systems and configure the update. Only after this verification can the dashboard be used for regular analytics.
Is it possible to make a dashboard in Excel?
Yes, you can create a dashboard in Excel using tables, pivot tables, charts, formulas, and slicers. This option is suitable for small data sets and relatively simple tasks.
If you have multiple sources and require regular automation, maintaining an Excel file becomes more difficult. Then it makes sense to consider Power BI or another BI system.
What is a dashboard in Power BI?
The Power BI dashboard displays metrics based on data connected to or loaded into Microsoft Power BI. Users can work with charts, filters, tables, and multiple levels of detail.
Power BI is especially convenient when you need to combine multiple sources and refresh data on a schedule. Before setting up a dashboard, you typically create a model and metric calculation rules.
What metrics should be included in a sales dashboard?
Typically, revenue, number of deals, conversion, average order value, plan fulfillment, and funnel metrics are used. The set is supplemented by data on managers, lead sources, and lost deals.
KPIs should be selected based on the sales process. The same dashboard structure will be of little use for both a short transactional model and long B2B deals.
How often should I update my dashboard data?
The frequency depends on the rate of change and the decisions the user makes. Operational data may be updated several times a day, while some financial indicators may only need to be recalculated once a day or after the end of the period.
Increasing the frequency unnecessarily is not recommended. This increases the load on integrations and infrastructure, but does not always improve the analytics' usefulness.
What does a dashboard consist of?
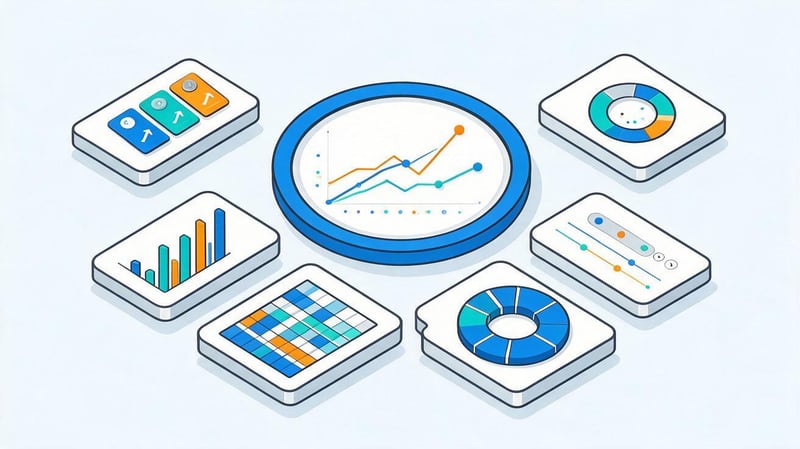
Typically, a dashboard is built around several key metrics and interconnected blocks. The most important KPIs are displayed on the main screen, with additional detail available in tables, filters, or separate pages.
Most often, the structure includes the following elements:
- cards with key indicators, where the current value, dynamics and comparison with the previous period are visible;
- graphs and charts that show how data changes over time or differences between categories;
- tables with details by products, managers, traffic sources, regions or other parameters;
- filters for selecting a period, segment, channel, division or a specific group of data;
- plan-vs-actual and other comparative blocks, where deviations from the expected result are immediately noticeable.
The number of elements depends on the task. If the dashboard is overloaded with dozens of graphs, it becomes difficult for the user to understand which indicators require attention.
What are dashboards for?
The dashboard's primary goal is to shorten the path from raw data to understandable metrics. Instead of switching between multiple services, users are presented with a single screen that displays the current status, trends, and deviations.
Business dashboards are often used to monitor sales, finance, marketing, and operational processes. When data is updated automatically, employees don't have to constantly transfer values between tables and manually compile identical reports.
The dashboard helps solve several practical problems:
- compare results from different periods and quickly notice sudden changes;
- monitor key indicators and implementation of the established plan;
- combine data from CRM, advertising systems, GA4, ERP and other sources;
- find areas where the actual result differs from the planned one;
- control the sales funnel, advertising costs and customer acquisition cost;
- track changes without preparing a separate report for each meeting.
At the same time, the dashboard system must take into account employee access levels. Financial indicators, advertising expenses, and management reporting can be accessible to different user groups.
Who needs dashboards?
Managers typically work with aggregated indicators. They need to see revenue, profit, plan/actual, expenses, sales, and key variances to understand the overall state of the business without combing through hundreds of rows.
A sales manager benefits from deeper detail. This dashboard shows the sales funnel, the number of new deals, conversion rates between stages, average order value, plan fulfillment, and the performance of individual managers.
A marketer needs ad spend, impressions, clicks, leads, CPL, CPA, ROAS, and sales by channel. An analyst works with more detailed slices, filters, and segmentations, as they need to identify the causes of changes and verify data quality.
How does the dashboard work?
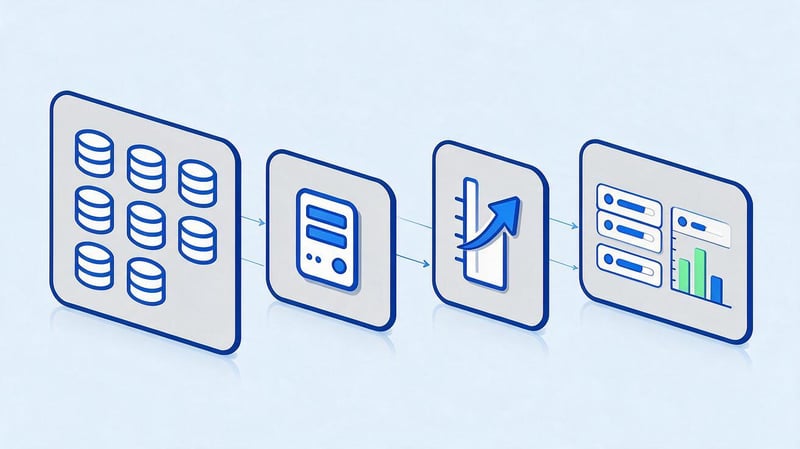
The work begins with the data source. This could be a CRM, ERP, 1C, Google Analytics 4, an advertising system, Microsoft Excel, Google Sheets, a database, or an external service API.
The data is then loaded into a BI system or other application, where it is cleaned, combined, and used to calculate the required metrics. After processing, the results are presented in graphs, tables, KPI cards, and other elements.
The diagram can be represented as follows:
Data sources → processing and merging → calculating indicators → visualization → updating → user analysis.
If errors occur at any stage, the dashboard may display incorrect values. Therefore, checking the source data and calculation logic is necessary before launching the dashboard.
Where does the dashboard get its data from?
A simple Excel dashboard can work with a single table, where the user manually adds new rows. A more complex system receives data from multiple sources simultaneously and updates it without constantly copying data.
In practice, the following sources are used:
- CRM with data on clients, leads, deals and sales statuses;
- ERP and 1C with information on finances, goods, payments and business transactions;
- Google Analytics 4 with data on users, events, sources and conversions;
- advertising accounts of Google Ads, Meta Ads and other platforms;
- Excel and Google Sheets, where plans, budgets and additional lookup tables can be stored;
- databases and APIs through which the BI dashboard directly receives the required indicators.
Before connecting, you need to check the field names, date formats, currencies, and calculation rules. Even high-quality visualization won't correct an error that appeared in the source table.
How is data updated in the dashboard?
Dashboard updates depend on the source and task. For a monthly financial report, downloading once a day is sometimes sufficient, while an operational sales dashboard may need to be updated several times an hour.
With a manual setup, an employee replaces or supplements the original file. With automatic integration, the system receives data on a schedule via a connector, API, or direct connection to the database.
Not every project requires real-time data. The higher the update frequency, the greater the demands on infrastructure, processing speed, and data quality control.
What makes a dashboard interactive?
The interactive dashboard responds to user actions and helps explore data without creating a new report. For example, a manager selects a specific month, after which all charts are automatically adjusted to reflect the selected period.
Filters allow you to view specific channels, regions, products, or teams. Segmentation helps compare user groups, and a drill-down reveals detailed data within the selected metric.
Sorting, switching indicators, and drilling down are especially useful for analytics where a single overview chart is insufficient. Users can start with the overall trend and then drill down to the specific cause of the change.
What types of dashboards are there?
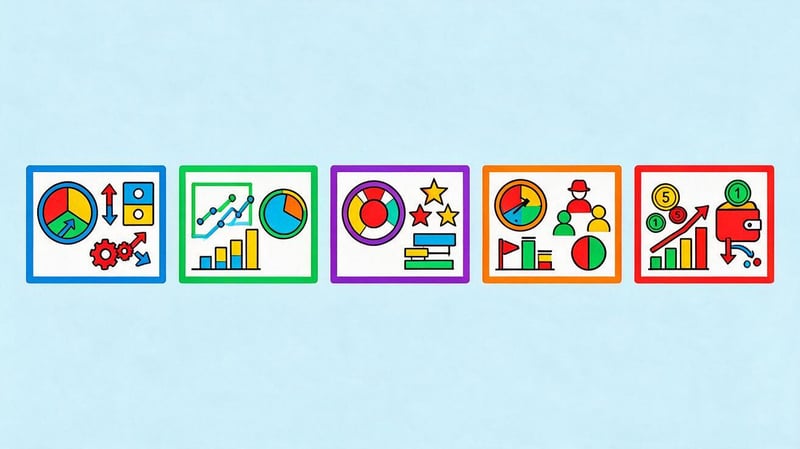
Dashboard types vary by purpose, audience, and level of detail. One screen is suitable for daily monitoring, another is used in management meetings, and a third is needed by analysts for data exploration.
In practice, the boundaries between these types can overlap. For example, a management dashboard sometimes contains both strategic metrics and operational sales data.
Operational dashboard
An operational dashboard is used for regular monitoring of current processes. Key indicators here are those that change frequently and require employee response within a day or week.
In the sales department, this screen can display new requests, deals without a follow-up task, overdue payments, and manager results. In the warehouse, inventory balances, order processing speed, and items requiring replenishment can be displayed.
An operational dashboard should quickly show deviations. The user needs to know where the problem occurred and which area needs to be addressed now.
Analytical dashboard
The analytical dashboard is designed to study relationships and dynamics. Users compare periods, segments, channels, products, and other groups to understand the reasons behind performance changes.
This section typically offers more filters, tables, and drill-down options. An analyst might need to compare traffic to sales, advertising costs to revenue, or average order value changes across different customer categories.
BI dashboards are especially useful for this type of work because they allow you to combine multiple sources and build calculated metrics.
Strategic dashboard
A strategic dashboard displays a small number of high-level metrics. Its audience is owners, directors, and executives who need to see the overall performance of the company without the daily operational details.
The screen can display revenue, profit, margins, budget execution, customer base dynamics, and other KPIs. The time periods here are typically larger: month, quarter, or year.
Such a dashboard must maintain a stable structure. If the composition of indicators is constantly changing, comparing results between periods becomes more difficult.
Management dashboard
A management dashboard brings together the metrics a manager needs to monitor a specific area or the entire business. The composition depends on the user's management level and responsibility.
For a company director, this might include sales, finance, marketing, and key operational indicators. For a department head, the dashboard typically contains more detail about their team, processes, and plans.
A good management dashboard shows actual results next to a baseline for comparison: a plan, a previous period, or a set standard.
What to show to the manager?
On the first screen, a manager usually only needs a few key indicators. If all available data is displayed at once, the most important changes are lost among the secondary figures.
The most commonly used indicators are revenue, profit, sales volume, plan fulfillment, expenses, number of leads, and key variances. For each indicator, it's best to show the trend or comparison to the target.
Additional information can be moved to the second level of detail. Managers first see the big picture and, if needed, drill down to a specific channel, department, or period.
Financial dashboard
A financial dashboard helps monitor a company's financial performance. Depending on the task, it displays revenue, expenses, profit, margin, budget, cash flow, and accounts receivable.
It's advisable to accompany indicators with comparisons to the plan or the previous period. A single figure without context often doesn't explain whether a result is normal or requires attention.
When working with financial data, a consistent calculation methodology is especially important. If different departments calculate revenue or profit differently, the dashboard figures will generate debate rather than analysis.
Where are dashboards used?
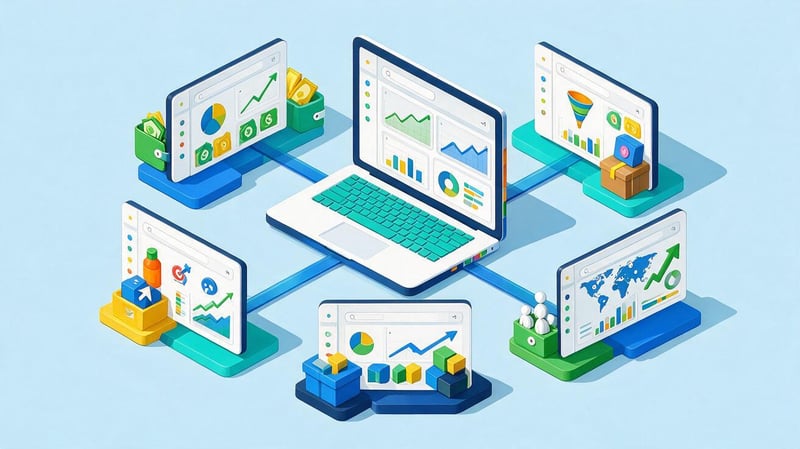
Dashboards are used in companies that regularly analyze recurring metrics. The business sector influences the data composition, but the principle remains the same: the user receives a limited set of metrics relevant to their task.
For an online store, this could be orders, average order value, and advertising costs. For a clinic, this could be inquiries, appointments, and specialist workloads. For a B2B company, this could be leads, deals, and sales cycle duration.
Dashboard for business
A business dashboard gathers key company metrics in one place. It can combine data from sales, marketing, finance, and internal processes if a manager needs to view them all together.
For example, a decline in revenue can be compared with the number of leads, sales department conversion rates, and advertising costs. This correlation helps quickly identify the area where changes occurred.
Business dashboards don't necessarily need to contain every available data point. It's much more useful to select metrics that are regularly used in management decision-making.
Sales Dashboard
The sales department dashboard displays the status of the sales funnel and the team's performance. It allows you to compare the number of leads, new deals, payments, conversion rates, average order value, and plan fulfillment.
The manager can see at which stage the most clients are lost and how much individual managers' results differ from the average. This data must be evaluated taking into account the number of leads and the complexity of the deals.
A sales dashboard is especially useful if the data is automatically pulled from a CRM. Manual data uploads increase the risk of errors and quickly become outdated.
Dashboard for the Head of Sales
A department head requires more detail than a company director. In addition to total revenue, they need metrics for funnel stages, employees, lead sources, and deal processing times.
The sales department dashboard can be supplemented with manager activity, deal duration, and the number of pending requests. This helps isolate the overall demand issue from specific challenges within the sales process.
However, it's not advisable to use employee ratings without context. Different managers may work with different products, segments, and volumes of incoming requests.
Plan vs. actual in the dashboard
The plan-to-actual dashboard displays the target value next to the current result. The user sees not only the absolute figure but also the percentage of plan completion for the selected period.
For example, with a sales plan of UAH 1.5 million and actual results of UAH 1.2 million, the dashboard might show 80% completion. It's also useful to compare the current pace with the number of days elapsed in the month.
This block is suitable for sales, marketing budgets, expenses, and other metrics where a target value has been set in advance.
Marketer's dashboard
A marketer's dashboard combines data from advertising channels and web analytics. The most commonly used metrics are impressions, clicks, costs, CPC, leads, CPL, CPA, conversions, and ROAS.
If a business feeds real sales into analytics, the marketing dashboard becomes more useful. Then you can compare channels based on revenue generated, not just the number of requests.
It's advisable to link the marketing dashboard to a CRM or other customer tracking system. Otherwise, the advertising account only shows the top portion of the customer journey.
Dashboard in 1C
The 1C dashboard can use data on sales, products, payments, debts, and other transactions already stored in the system. Specific capabilities depend on the configuration and connection method.
Sometimes the built-in 1C reports are sufficient for the user, while other times it's more convenient to transfer the data to Power BI or another BI system. The decision depends on the number of sources, the required visualization, and the refresh rate.
If data from 1C is combined with CRM or advertising systems, common identifiers and record matching rules must be defined in advance.
What metrics should I add to my dashboard?
The number of available metrics almost always exceeds the number of indicators a user can regularly analyze. Therefore, the decision a user must make is first determined, and then the data for that decision is selected.
If a metric doesn't influence user actions or help evaluate results, it doesn't need to be on the first screen. Additional information can be included in the drilldown.
Sales dashboard KPI
A sales dashboard typically includes revenue, number of deals, average order value, conversion rate, and plan fulfillment. For a long sales funnel, stage transition metrics and deal duration are also useful.
Lost deals, rejection reasons, and overdue tasks can be displayed separately. This data helps identify the area of the process where a systemic problem is occurring.
The composition of KPIs depends on the business model. For an online store and complex B2B sales, the same set of metrics will yield different practical value.
Marketing dashboard KPIs
A marketing dashboard most often includes impressions, clicks, costs, CPC, leads, CPL, CPA, and conversions. If sales data is available, revenue and ROAS are added.
It's best to analyze metrics by channel and campaign, as overall results can mask significant differences within an advertising budget. One source may grow while another loses effectiveness.
For SEO, organic traffic, search clicks, visibility, rankings, conversions, and landing page metrics are also used.
Financial and management indicators
Financial and management dashboards typically use revenue, expenses, profit, margin, budget, and cash flow. The specific set depends on the accounting model and user level.
For the owner, it's useful to see business dynamics and budget deviations. A financial specialist will need a more detailed breakdown by item, division, and period.
Before launching, it's important to agree on metric definitions. If the term “revenue” is calculated differently in different systems, using the same name on two graphs will lead to erroneous comparisons.
Dashboard examples
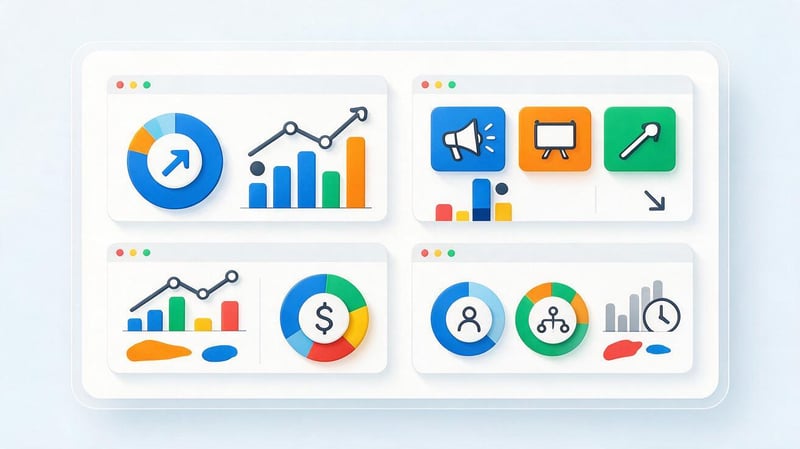
A dashboard example is best evaluated through the problem it solves. Beautiful dashboards can look convincing in a presentation, but a working dashboard should help people quickly read the data and spot deviations.
Below are some typical options. When preparing your page, it's best to supplement them with your own layouts or real, anonymized examples.
Sales dashboard example
The first screen displays revenue, number of transactions, average order value, and plan fulfillment. Below are a sales dynamics chart, a sales funnel, and a manager results table.
Example data for a sales chart:
| Month | Revenue, UAH | Plan, UAH | Fulfillment |
|---|---|---|---|
| January | 1,120,000 | 1,200,000 | 93% |
| February | 1,280,000 | 1,250,000 | 102% |
| March | 1,310,000 | 1,400,000 | 94% |
| April | 1,520,000 | 1,450,000 | 105% |
A graph of this data will immediately show the months where actual sales fell short of plan. The spreadsheet will also retain the exact values for verification.
Marketing dashboard example
A marketing dashboard can start with total expenses, number of leads, CPL, and sales. Below that, it's convenient to show the results of individual traffic sources and the change in cost of acquisition by week or month.
The additional table helps you compare Google Ads, Meta Ads, organic search, and other channels using the same metrics. If you use unified attribution, you can add revenue and ROAS to these.
The main requirement is the same calculation logic for all channels. Otherwise, the comparison will appear accurate, even though the metrics are derived using different rules.
An example of a financial dashboard
A financial dashboard can display revenue, expenses, profit, margins, and budget. Linear or bar charts are used for dynamics, and a separate table is convenient for displaying the expense structure.
It's useful for a manager to see plan vs. actual and the variance in monetary terms. A finance specialist will also need breakdowns by expense category, department, or project.
If data comes from multiple systems, currencies, transaction dates, and revenue recognition rules should be verified before visualization.
Example of a management dashboard
A management dashboard typically contains fewer elements than an analytical dashboard. The first screen displays several KPIs that provide an overall picture of the company or department.
For example, the director can view revenue, profit, plan fulfillment, sales volume, marketing expenses, and customer base dynamics. Detailed information is available on additional pages.
This approach reduces information overload. The user first sees the deviation and then, if necessary, opens the details.
How to create a dashboard?
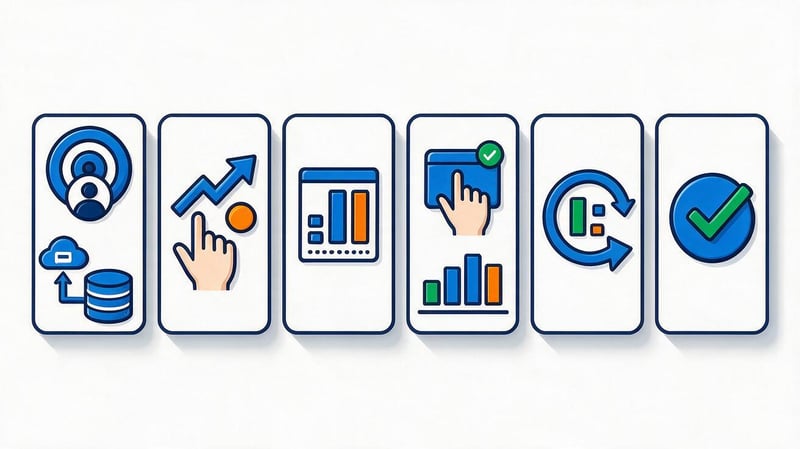
Design doesn't start with choosing the chart colors or even the software. It begins with identifying the user, their tasks, and the metrics that truly influence decisions.
After this, sources are selected, the structure is thought out, and only then do they move on to technical implementation. This order reduces unnecessary charts and rework.
Lead SEO specialist — Gennady
I evaluate a dashboard not by the number of graphs, but by whether it helps make a specific decision. If a manager sees twenty metrics but doesn't understand where the deviations from the plan are and what requires attention, the dashboard isn't doing its job. First, I define the goal and 5-7 key metrics, then the data sources, and only then the visualization. The less manual processing there is between the initial data and the final metric, the more reliable the analytics.
1. Define the goal and user
Before creating a dashboard, you need to understand who will use it. A company executive and a contextual advertising specialist require different levels of detail.
The next question concerns the decisions a person should make after viewing it. If the goal is stated as “show all the data”, the structure will almost certainly be overloaded.
It's best to write down a few specific questions. For example: is the sales plan being met, which advertising channel is generating the most expensive leads, and where has conversion changed?
2. Identify data sources
Next, compile a list of systems that contain the required metrics. This could include a CRM, Google Analytics 4, an advertising account, 1C, ERP, Excel, or an internal database.
For each source, you need to check data availability, update frequency, and the ability to automatically connect. Some indicators can be obtained directly, while others require preliminary calculations.
If the same metric is stored in multiple locations, select the primary source in advance. Otherwise, users will compare different values for the same metric.
3. Select metrics and KPIs
Once the sources are identified, a list of metrics is created. Each KPI should answer a specific user question and have a clear calculation rule.
Don't add metrics just because the system can report them. The more secondary values appear on the first screen, the less visible the truly important changes are.
For each indicator, it's advisable to define a period, unit of measurement, and comparison base. This could be the previous month, the plan, or the same period last year.
4. Prepare the structure and prototype
Before development, it's helpful to draw a simple dashboard prototype. This will help you define the locations of key KPIs, graphs, tables, and filters.
Key indicators are typically placed at the top of the screen. Below them are dynamics, structure, and details that help explain changes in the final figures.
The prototype can be prepared in Figma, a spreadsheet, or even a standard diagram. At this stage, the logic of reading the data is more important than the visual design.
5. Choose a program to create a dashboard
Dashboard creation programs vary in features, price, connection methods, and specialist requirements. A simple report can be created in Excel, but for multiple sources, a BI platform is more often the choice.
The choice depends on the volume of data, the number of users, and the required automation. Sometimes a ready-made cloud solution is sufficient, while others require a separate system with its own data model.
Before implementation, it is useful to check license restrictions, update frequency, and available connectors.
6. Customize visualization and filters
After preparing the data, select the appropriate visualization type for each indicator. Dynamics are best shown using lines or columns, while precise values are best shown using cards and tables.
Filters are added only where the user will actually change the slice. Too many controls complicate the interface and increase the risk of misinterpretation.
Chart titles should clearly explain their content. Users shouldn't have to guess what the indicator means or what date is used in the calculation.
7. Set up data updates
The update frequency depends on how quickly the metric changes. Online store sales can be updated several times a day, while some financial metrics can be updated after the end of the corresponding period.
When connecting automatically, you need to check exactly when the system receives new data. There can be a delay between an operation appearing in the source and it being displayed in the dashboard.
It's a good idea to display the last update date to the user. This helps prevent outdated numbers from being perceived as current.
8. Check the data
Before launch, dashboard values are compared with the source systems. Validation is performed across multiple periods and different slices, not just one convenient example.
Particular attention is paid to filters, currencies, time zones, duplicates, and calculation formulas. Even a small error in logic can alter the final KPI.
After launch, the check is repeated whenever the sources, data structure, or formulas change. Data quality requires constant monitoring.
What programs can I use to create a dashboard?
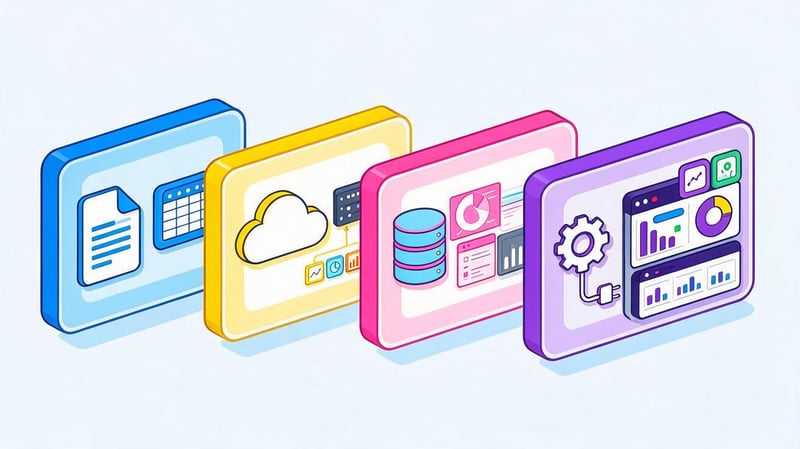
The choice of software depends on the complexity of the project. A spreadsheet is suitable for a small set of metrics, while a BI platform is more convenient for automated analytics across multiple systems.
Below is a basic comparison of popular options.
| Tool | What is it suitable for? | Data sources | Interactivity | Complexity |
|---|---|---|---|---|
| Microsoft Excel | Small reports and local data | Tables, files, individual connections | Average | Low |
| Google Sheets | Collaboration and simple panels | Tables, scripts, integrations | Average | Low |
| Looker Studio | Marketing and web analytics | GA4, Ads, Sheets, connectors | High | Average |
| Microsoft Power BI | Business Intelligence and Multiple Sources | Databases, files, APIs, services | High | Medium/high |
| Tableau | Complex visualization and analytics | Databases, files, cloud services | High | High |
Before choosing, it's a good idea to check which sources are already in use within the company. Sometimes, having a ready-made connection is more important than additional platform features.
Dashboard in Excel
An Excel dashboard is suitable for small projects where data is already stored in tables. Pivot tables, charts, formulas, and slicers can be used for visualization.
Ready-made dashboards in Excel are convenient for working without a separate BI system, but with a large number of sources, the amount of manual processing increases. Furthermore, file version control becomes more difficult.
If a table is used by multiple employees, you need to think through update rules and formula protection in advance.
How to make a dashboard in Excel?
To create a dashboard in Excel, first prepare a source table with a clear structure. Rows should contain individual records, and columns should contain similar data types.
Next, you can create pivot tables, build charts, and add slicers to select a period or category. All key elements are collected on a separate sheet so the user doesn't have to work directly with the source data.
If the data is updated regularly, it's advisable to automate the process via a connection or Power Query. Otherwise, the employee will have to repeat the same steps manually each time.
Dashboard in Power BI
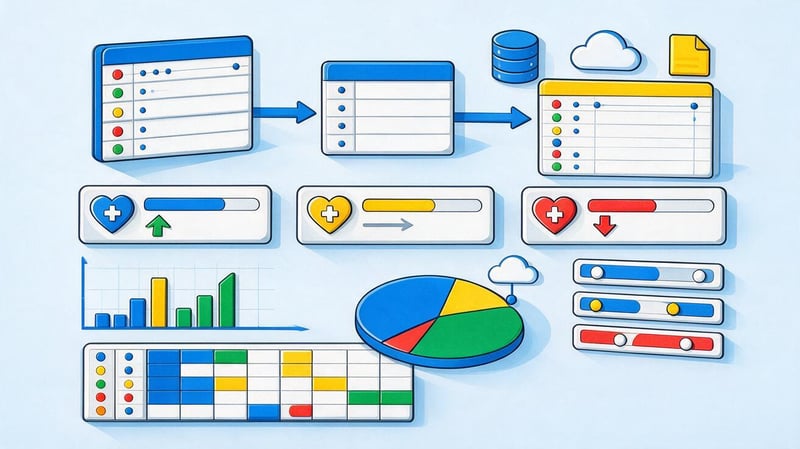
The Power BI dashboard is suitable for projects that require combining different sources and building interactive business analytics. The system supports data models, calculated metrics, filters, and multiple levels of detail.
The Power BI dashboard can retrieve data from files, databases, cloud services, and other systems. After setting up the model, users work with ready-made reports without changing the original formulas.
This option requires more careful data preparation than a simple spreadsheet. However, with regular analysis, automation reduces the amount of manual work.
What dashboards can be made in Power BI?
In Power BI, you can create a sales dashboard displaying revenue, deals, planned and actual figures, and manager performance. A separate financial report can show expenses, profit, and budget structure.
For marketing, Power BI integrates data from advertising systems, web analytics, and CRM. This helps compare expenses with actual sales and evaluate channels using a unified model.
The system is also suitable for management panels, logistics, warehouse analytics, and other processes that require structured data.
Dashboards in Looker Studio
Looker Studio is often used for marketing reports and web analytics. The service seamlessly integrates with Google products and supports third-party connectors.
Online dashboards can be opened in a browser and shared with colleagues or clients. Users can select a period, source, or other settings using interactive filters.
For a complex data model, the service's capabilities may be insufficient. In such cases, calculations are prepared in advance or a more powerful BI system is used.
Tableau and other BI systems
Tableau is used for complex visualizations, analytical research, and working with multiple sources. The platform supports interactive dashboards and deep drill-down.
There are other BI dashboards on the market, varying in price, deployment options, and available integrations. Choosing a system based solely on feature count isn't recommended.
It's much more important to check how it connects to your data, who will be maintaining the model, and how many users should have access.
Is it possible to create a dashboard online?
You can create a dashboard online in Looker Studio, Power BI Service, and other cloud platforms. Users don't need to open a local file on a specific computer each time.
The online dashboard is convenient for team collaboration and regular metric review. Access can be restricted to specific users or groups, depending on the service's capabilities.
When choosing a cloud solution, consider security, access rights, and data storage policies. For sensitive financial information, these issues should be addressed before publishing the dashboard.
What should a good dashboard design be like?
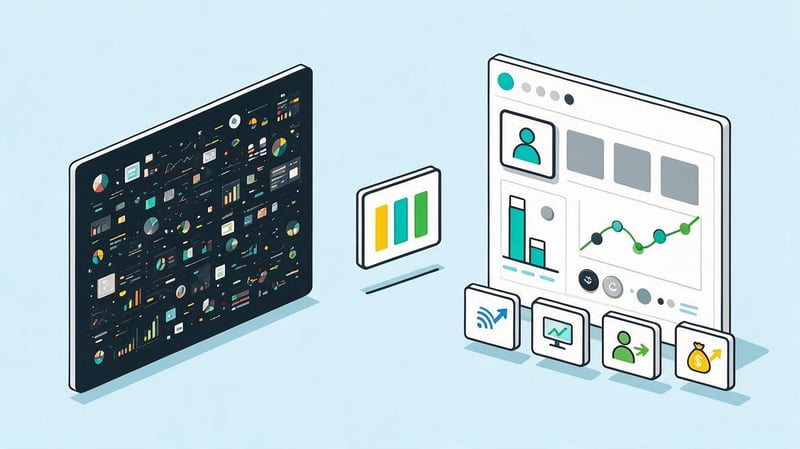
Dashboard design begins with the structure of the information. Users should be able to quickly find the main indicator, see the direction of change, and understand where further details can be found.
Beautiful dashboards are often used as references, but visual appeal doesn't guarantee usability. If the graphs are difficult to read or the colors don't have a clear logic, the design hinders analysis.
Information hierarchy
The most important indicators are placed where the user looks first. This is usually at the top of the screen and the first blocks from left to right.
Minor details can be placed below or on additional pages. This approach helps maintain a clear reading order.
If every element is presented as the primary element, information hierarchy disappears. Therefore, the size, position, and density of blocks should correspond to their role.
Proper data visualization
A line graph is good for showing how a metric changes over time. A column chart is suitable for comparing categories, while a table is useful when the user needs to see precise values.
KPI cards are convenient for a few key figures. Pie charts are best used only for a small number of categories, where the percentages are easily distinguished visually.
A dashboard's visualization should match the user's question. The same data set can be presented in different ways, but not every approach will be equally clear.
Colors and accents
Color helps highlight deviations, statuses, and selected elements. If each chart uses its own vibrant color palette, the screen quickly becomes cluttered.
It's best to maintain consistent labels for similar categories across different pages. For example, a single channel or status shouldn't change color from chart to chart without reason.
Red and green should also be used with caution. Besides being accessible to people with color blindness, these colors are often perceived as an assessment of the result.
Minimum information noise
Excessive grids, labels, frames, and decorative elements increase visual clutter. Users spend more time reading the screen and are less likely to notice changes in the data.
Labels should be short and clear, but not so abbreviated that their meaning has to be guessed. If a metric requires a longer explanation, it can be included in a tooltip.
Good dashboard designs maintain sufficient white space between blocks. This helps visually separate different groups of metrics.
Common mistakes when creating a dashboard
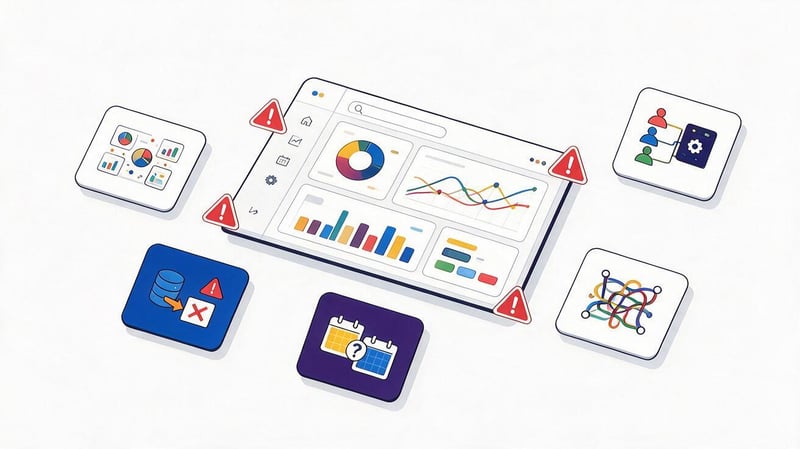
Most problems arise even before the design stage. If the purpose of the panel isn't defined, the developer tries to fit all available data onto the screen and ends up with an overloaded interface.
The second common problem is related to the quality of sources. A CRM error, duplicate data imports, or different calculation rules can ruin the result, regardless of the visualization quality.
Common mistakes include:
- too many KPIs, between which the user cannot prioritize indicators;
- lack of a clear purpose and specific audience for the dashboard;
- graphs without a comparison base, period, or explanation of the metric used;
- inappropriate visualization type that makes simple data difficult to read;
- different rules for calculating the same indicator in several sources;
- mixing incomparable periods without proper explanation;
- manual updating where the report is used daily and quickly becomes outdated;
- lack of verification of figures after changing the integration or original structure;
- the same dashboard for the director, analyst, and operations officer.
After fixing the errors, the new dashboard should be tested again using real-world scenarios. Users should be able to find the information they need without additional instructions or manual calculations.
How to choose a dashboard for your needs?
The selection process begins with the task, not the program name. First, determine who will view the dashboard, what decisions they need to make, and what KPIs are needed to support that.
After this, check the dashboard data, available integrations, and required update frequency. Only then can you compare Excel, Looker Studio, Power BI, and other systems.
A convenient sequence looks like this:
task → user → KPI → data sources → program → visualization → update frequency → check.
For a small, local report, an Excel dashboard is sometimes sufficient. For multiple automated sources and a large number of users, a BI dashboard with a centralized data model is more suitable.
A dashboard template can be used as a starting point, but its metrics need to be tailored to your specific business. A one-size-fits-all screen that suits every company typically contains too much unnecessary information.
A dashboard helps organize key metrics in a clear structure and reduce the time spent on regular data verification. Its effectiveness depends on the correct selection of KPIs, the quality of sources, the logic of calculations, and clear visualization.
It's best to start with a specific user task and then choose Excel, Power BI, Looker Studio, or another system. If your data is spread across CRM, advertising, web analytics, and internal tables, Seo-Gen can help you create an analytics structure, define metrics, and create a dashboard tailored to your actual business processes.
More articles about SEO Promotion


