Web analytics: what is it and how does it work?


Traffic alone doesn't tell us much about a website's health. The same number of visits could be due to inquiries from potential customers, random clicks from ads, repeat customers, or users who closed the page after a few seconds. Therefore, website statistics are insufficient when it comes to understanding the true value of traffic.
Web analytics connects visitor actions with referral sources, pages, advertising campaigns, and business goals. It helps you see which channels are bringing in the right audience, where users stop along the way, and what changes impact conversion rates. Website analytics is essential for marketers, SEO specialists, business owners, product teams, and developers.
The work uses data on visits, events, sales, search traffic, advertising costs, and user actions. This information is then compared, segmented, and tested in the context of a specific task. This is how website performance is analyzed, and decisions are based on data, not on isolated report figures.
What is web analytics and how does it work?
In simple terms, web analytics is the systematic management of website or app visitor data. It includes data collection, quality assurance, processing, analysis, visualization, and interpretation. The result is usually a conclusion about what's happening with the website and what actions need further investigation.
Search queries like “web analytics”, “web analytics is”, and “website analytics is” often lead to the same question: how does analytics differ from simply viewing statistics? Statistics show metric values for a selected period, while analytics helps understand the connections between the referral source, user behavior, and the final target action.
For example, an online store received 40,000 visits and 500 purchases in a month. These figures provide a basic understanding of the results, but to solve a marketing problem, it would be necessary to understand which channels generated sales, which product categories were involved in purchases, where users abandoned their carts, and the cost of acquiring an order.
What are the stages of web analytics?
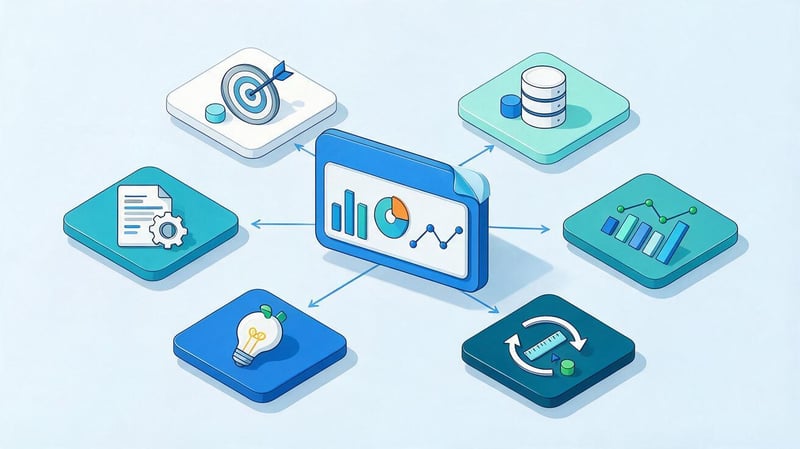
Data management is structured sequentially. First, a company defines measurement goals, then configures data collection, verifies the accuracy of events, generates reports, and only then proceeds to conclusions. If you do it the other way around, you can easily end up with a beautiful dashboard that doesn't answer any operational questions.
The full cycle can be represented as a sequence: goal → data collection → data processing → data analysis → data interpretation → hypothesis → modification → repeat measurement. This approach is used for SEO, advertising campaigns, e-commerce, content projects, and product analytics.
Data collection
Data collection begins with defining the actions that need to be measured. For an informational website, this might include content views, scrolls, and internal link clicks. For a service, form submissions, phone calls, consultation bookings, or contact page clicks are more valuable. For an online store, e-commerce events from product views to purchases are needed.
Information comes from several sources. The website itself transmits events and event parameters, advertising accounts contain costs and campaign data, Google Search Console displays search queries, CRM stores leads and deals, and call tracking links phone calls to traffic sources. The more complex the project, the more attention is required to ensuring consistency of this data.
Data processing and merging
Raw events don't provide a ready-made answer. They need to be linked to users, sessions, pages, advertising tags, and other parameters. Projects with authentication can use User ID, while analytics systems use their own identifiers, including Client ID, for technical browser identification.
If a business receives inquiries through a website, phone calls, and CRM, the data often needs to be consolidated. In this case, an analytics platform or data warehouse links visits, leads, and subsequent sales. For larger projects, BigQuery is used, allowing for processing raw events, writing SQL queries, and connecting analytics with internal databases.
Analysis and interpretation
The report answers the question of how many users, events, or orders occurred during a period. Analysis begins when metrics are compared across segments, channels, and periods, and then an explanation for the changes is sought. For example, a decrease in the overall number of inquiries could be due to a drop in organic traffic, ad disabling, or a problem with a specific form.
Interpreting data requires context. A rise in bounce rate on one page may indicate a problem, while on another it may be normal user behavior, with users quickly receiving a phone number or the desired answer. Therefore, website analytics must consider the page's purpose, traffic source, and user journey.
Testing hypotheses and improving the website
After the analysis, a testable hypothesis is formulated. If mobile users frequently access the form but rarely submit it, the team checks the usability of the fields, validation errors, page speed, and element display. Then, they implement the change and compare the before and after metrics.
For some tasks, A/B testing is suitable, while for others, sequential data comparisons are sufficient. It's important to define the metric by which the results will be assessed in advance. Without such a criterion, any change can easily be explained retroactively, so the analytics cycle must conclude with a repeat measurement.
How is website analytics different from regular statistics?
Website statistics typically answer questions about quantity: how many users, sessions, views, or clicks there were. Detailed website statistics are useful for monitoring trends, but rarely explain the cause of changes on their own. To solve this problem, segments, traffic sources, events, and business metrics must be added.
Website web analytics works with the same figures, but considers them in conjunction. If traffic has increased by 25%, the analyst will check where the increase came from, which pages received it, and how target actions have changed. This approach helps distinguish between beneficial growth and a situation where the site has received more irrelevant visits.
Answers to your questions
What is web analytics in simple terms?
Web analytics is best explained through data about visitors and their actions. The system records referral sources, pages, events, and target actions, and then uses these metrics to analyze website performance.
In a broader sense, analytics refers to the process of working with data to draw conclusions. In the context of a website, this refers to audience behavior, marketing channels, and interaction results.
Why does a website need web analytics?
It helps you understand where users come from, what they do, and which sources drive the desired results. This allows you to test advertising campaigns, SEO, content, forms, and individual stages of the funnel.
Web analytics and website promotion are closely linked because rankings and traffic only describe part of the result. After a user clicks through, it's important to evaluate their subsequent actions on the site.
What data does web analytics show?
Web analytics systems can display users, sessions, views, referral sources, devices, events, and key actions. With proper e-commerce configuration, purchases, products, revenue, and checkout steps are also available.
After integration with CRM or other systems, reporting can be supplemented with leads and sales. The data set depends on the project type and configured events.
What tools are used for web analytics?
Web analytics tools include GA4, GTM, Search Console, Looker Studio, BI, BigQuery, CRM, and behavioral services. Each covers a specific area: collecting, transmitting, storing, visualizing, or interpreting information.
Web analytics tools are selected after defining the task. A small website typically requires fewer services than a large online store with multiple sales channels.
How is Google Analytics different from Google Tag Manager?
Google Analytics 4 receives events and helps analyze users, sources, and target actions. Google Tag Manager manages tags and their trigger conditions, through which some of this data is transmitted to analytics systems.
Therefore, GTM does not replace a web analytics service. These solutions often work together, but perform different technical functions.
What are website statistics and how are they different from analytics?
Website statistics can be explained through a set of measured values: the number of users, views, or sessions over a period. The website statistics service displays these metrics in a convenient report.
Analytics adds comparison, segmentation, and interpretation. It helps identify the causes of metric changes and verify the impact of marketing or website changes.
What are the most important web analytics metrics?
There's no single set of metrics, as they depend on the project's goal. For a store, purchases and revenue are critical; for a service website, qualified inquiries are key; for an information resource, interaction with content and subsequent clicks are key.
Web analytics: what a web specialist needs to know begins with selecting metrics for the task. The more precisely the goal is defined, the easier it is to separate useful metrics from information noise.
How often should you analyze website data?
Operational metrics can be monitored daily or weekly if the data volume warrants it. Strategic conclusions are best drawn based on a period in which a sufficient sample has been accumulated for comparison.
Online website analytics doesn't mean every chart change requires immediate action. Frequent fluctuations may be just noise, so it's important to first check the context and scale of the change.
Why do you need web analytics?
The question “why do we need web analytics” is primarily related to website management and marketing. Without measurement, a company can see inquiries and sales, but have a poorer understanding of their origins. With multiple advertising channels, SEO, email, and social media, it becomes difficult to determine the contribution of each source without proper analytics.
Web analytics for businesses helps evaluate audiences, traffic quality, page performance, and the customer journey. Using this data, you can reallocate advertising budgets, select pages for improvement, identify technical issues, and assess the impact of changes on conversion.
What tasks does web analytics solve?
Web analytics objectives vary depending on the business model and website type. For media, content consumption and audience retention are key, for online stores, purchases and revenue, and for B2B, leads and their quality. Therefore, a single set of reports isn't suitable for all projects.
In practice, analytics is used to monitor traffic, study visitor behavior, evaluate landing pages, advertising campaigns, and SEO. It also helps identify funnel errors and compare the performance of different audience segments.
Website audience analysis
Website visitor analytics shows how many people interacted with the resource and how their actions differ. You can compare new and returning users, devices, regions, acquisition channels, and other available segments. However, segmentation must be tailored to the specific task; otherwise, the report quickly becomes a jumble of numbers.
Target audiences rarely behave identically. A user from organic search might read an article and then proceed to a service, while a visitor from a branded ad might immediately submit a form. Analyzing these differences helps more accurately assess the quality of sources and user behavior.
Traffic source analysis
Traffic sources show how a visitor arrived at a website. Reports typically include Organic Search, Paid Search, Direct, Referral, Social, Email, and other traffic channels. UTM tags are also used for advertising campaigns to differentiate between campaigns, ads, and individual placements.
Comparing channels solely by the number of clicks isn't enough. One source may provide cheap paid traffic but generate almost no leads, while another may bring fewer visitors with significantly higher conversion rates. Therefore, internet analytics links visits to the results after the click.
User behavior analysis
User actions help us understand what happens after a page loads. Events can include clicks, form submissions, video views, interactions with elements, scrolling, and other actions related to the site's goals. Click maps and session recordings provide additional insights.
Visitor behavior is considered in conjunction with the page type and referral source. If users read an informational article and then proceed to a sales page, this scenario may be useful even without an immediate conversion. For an advertising campaign landing page, the criteria will be different.
Conversion and funnel analysis
Conversion shows what proportion of users completed the selected target action. Depending on the project, this action could be a lead, a call, registration, a purchase, a file download, or moving on to the next step. Conversion rate is always considered in the context of the source and audience.
A sales funnel helps identify losses between stages. For example, a user opened a product page, added it to their cart, initiated checkout, and completed the purchase. If a sharp drop occurs between two successive stages, the team has a specific area to investigate.
Analysis of website promotion effectiveness
Website promotion analytics connects search engine optimization, advertising, content, and other channels with targeted actions. It's useful to consider increases in rankings or organic traffic alongside conversion, revenue, and lead quality. A similar principle applies to paid campaigns.
Lead SEO specialist — Gennady
I view web analytics as a way to verify whether a website is delivering real results. An increase in organic traffic alone doesn't prove anything. I need to see which queries and pages are bringing in the right audience, how users navigate the site, and whether they submit an inquiry or make a purchase. If traffic is growing but conversions aren't, the goal of analytics is to identify where exactly the results are being lost and what needs to be changed.
What types of web analytics are there?
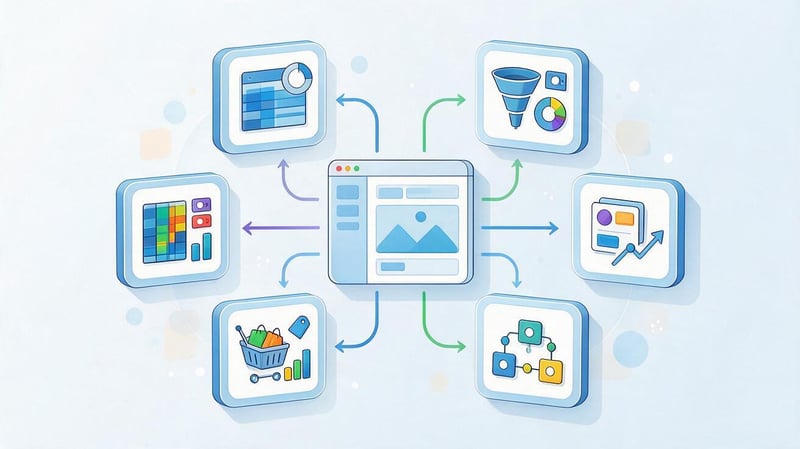
Web analytics methods vary by data source and purpose. A single project often utilizes several approaches simultaneously: classic traffic reports, e-commerce events, behavioral analysis, and CRM data. Drawing strict boundaries between them isn't always helpful, as their tasks overlap.
It's best to understand the basics of web analytics by understanding the purpose of each area. This will help you understand where a standard GA4 report is sufficient, and where sales data, advertising costs, or additional systems are needed.
Classic web analytics
A classic web analytics system collects data on users, sessions, pages, events, and traffic sources. This set covers most basic tasks: traffic assessment, channel comparison, content analysis, and monitoring of target actions.
For most projects, Google Web Analytics via GA4 remains the starting point. Companies also use other website analytics systems if required by their infrastructure, data storage policies, or internal processes.
Behavioral analytics
Behavioral analysis helps us understand how visitors interact with the interface. Audience analytics services can show clicks, scroll depth, action sequences, and replays of individual user sessions. This data is useful for identifying UX issues.
Results cannot be assessed in isolation from numerical metrics. A few session recordings help formulate a hypothesis, but to draw a conclusion, it is necessary to test it on a larger sample. In this way, qualitative observations complement quantitative analysis.
E-commerce analytics
E-commerce analytics describes the customer journey within an online store. Typically, it measures product list views, product card views, adding to cart, initiating checkout, selecting delivery, purchasing, revenue, and other e-commerce events.
Additionally, they track the average order value, customer share, repeat purchases, and losses between stages. Website analytics based solely on order volume, doesn't reveal where the problem lies in the funnel or which categories generate the most revenue.
End-to-end analytics
End-to-end analytics links advertising clicks to subsequent inquiries, transactions, and payments. To achieve this, website data is combined with CRM, advertising accounts, telephony, and other sources. This approach is especially useful where purchasing decisions are not made immediately after a visit.
Standard website analytics typically don't capture the full transaction cycle after form submission. Therefore, assessing revenue and lead quality requires transferring data between systems or collecting it in a separate data warehouse.
Content analytics
Analyzing your website's content helps you understand what attracts users and how they move forward. This is done by comparing views, engagement, interaction depth, internal link clicks, and subsequent target actions.
High traffic to an article alone doesn't necessarily demonstrate its value. A piece of content can attract a large audience without further clicks, while a less-visited article can regularly drive users to a service page. Content analytics should be linked to the user journey.
Marketing and SEO analytics
Internet marketing analytics combines data from multiple acquisition channels. It helps compare SEO traffic, advertising, email, social media, and other sources based on selected performance metrics. Advertising costs are also taken into account to evaluate advertising.
In SEO, analytics shows landing page results after a click from a search engine. The combination of Search Console and GA4 helps correlate search visibility with on-site behavior, although the metrics from these systems cannot be mechanically compared as identical data.
What data is used in web analytics?

The quality of the conclusions depends on the data collected and how correctly it's configured. Even a good analytics service won't be able to fix the situation if events are being transmitted twice, some inquiries aren't being recorded, or advertising campaigns are tagged using different rules.
Before creating reports, it's important to define the source system. This typically includes the website, app, advertising accounts, search statistics, CRM, and, if necessary, telephony. Then, check which identifiers and parameters will help link the data.
Website and application data
A website transmits data about page views, events, devices, and user actions. Apps operate on a similar principle, although they use screens and their own event model instead of pages. In GA4, events are the foundation for measuring interactions.
Event parameters add context. For example, a form submission event might include the form type or site location, while a purchase might include product details and the amount. This level of detail simplifies further segmentation.
Advertising systems data
Advertising accounts contain impressions, clicks, costs, ads, and campaign parameters. After integration with web analytics, you can compare acquisition costs with user actions on the site. However, attribution models and calculation rules may differ between systems.
CPA, CPL, ROAS, and other marketing KPIs are used for evaluation. The metric should be selected based on the campaign's goal, as clicks, leads, and actual sales describe different stages of the funnel.
Search engine data
Google Search Console displays organic search information: search queries, clicks, impressions, CTR, and average position, broken down into available categories. This data complements GA4, which analyzes user behavior after landing on a website.
This linking is especially useful for SEO. You can find pages with growing impressions, check their organic traffic, and then evaluate subsequent user actions. This web analysis helps separate visibility issues from issues with the landing page itself.
CRM and sales data
CRM stores information that's often missing from standard website analytics systems: lead status, assigned manager, transaction amount, payment date, and reasons for refusal. For B2B and services, this data is critical, because submitting a form doesn't necessarily mean a sale.
By correctly transmitting identifiers, the customer journey can be traced from the first source to payment. This helps calculate CAC, LTV, and the actual value of different channels, rather than relying solely on the number of inquiries.
Call tracking and other sources
For businesses with a high volume of phone calls, website analytics without call tracking will be incomplete. Call tracking helps link calls to advertising campaigns, sources, or user sessions if the technical framework is configured correctly.
Additional sources can include payment systems, ERP systems, email marketing platforms, and internal databases. These should only be added when the data is needed for a specific decision, as unnecessary integrations increase support complexity.
Key Web Analytics Metrics
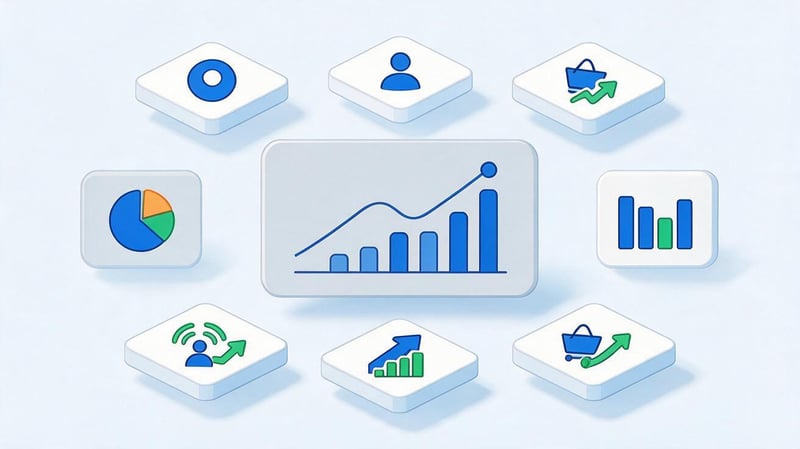
Web analytics metrics describe various aspects of user and business behavior. It's impossible to select a single key metric for all projects. An online store, a news site, and a corporate B2B resource will all evaluate success using different sets of data.
The analyst's main tool here is to formulate the right question. First, you need to determine what exactly needs to be tested, and then select the metrics. Otherwise, the report will contain dozens of indicators with no clear priority.
Audience and traffic metrics
Users shows users in the selected period, New Users helps you evaluate new audiences, Sessions reflects sessions, and Views reflects page or screen views. Together, these metrics provide a basic understanding of traffic scale.
For analysis, it's important to include the source, medium, and landing page. Two campaigns with the same number of visits can produce completely different results after the click, so website statistics should be considered alongside audience quality.
Behavioral metrics
GA4 uses engagement, engaged sessions, average engagement time, and events to measure interaction. Page views, scrolls, and other actions can also be analyzed if they truly help evaluate the content or interface.
Don't automatically interpret high interaction times as a positive sign. Users may spend a long time searching for the information they need due to a complex structure. Behavioral metrics are more effective when comparing similar pages and segments.
Conversion metrics
Key actions are measured using events that reflect business-relevant results. These could include submitting an inquiry, registering, purchasing, or another action related to the website's goal. The number of leads and the conversion rate are also calculated.
If you know your acquisition costs, you can add CPL or CPA. It's helpful to compare these metrics with lead quality, as the lowest cost per lead doesn't always lead to the most profitable sale.
Online store metrics
For an online store, it's important to have visibility into the entire purchase journey. Key data includes product views, add-to-cart, checkout start, purchases, revenue, and average order value. Additional analysis includes product, category, and sales sources.
If purchases have decreased, the funnel helps pinpoint the problem. The drop may occur as early as the product page viewing stage, when adding to cart, or during checkout. Each scenario requires separate testing.
Marketing KPIs
CAC measures the cost of customer acquisition, CPL measures the cost per lead, and CPA measures the cost per action. ROAS compares advertising revenue with advertising costs, and ROMI is used to evaluate the return on marketing investment (ROI) based on the chosen calculation method.
LTV describes the value of a customer over a longer time horizon. There is no universal formula for a set of KPIs, so marketing analytics tools should be selected in conjunction with the rules for calculating these metrics.
How to set up website web analytics?
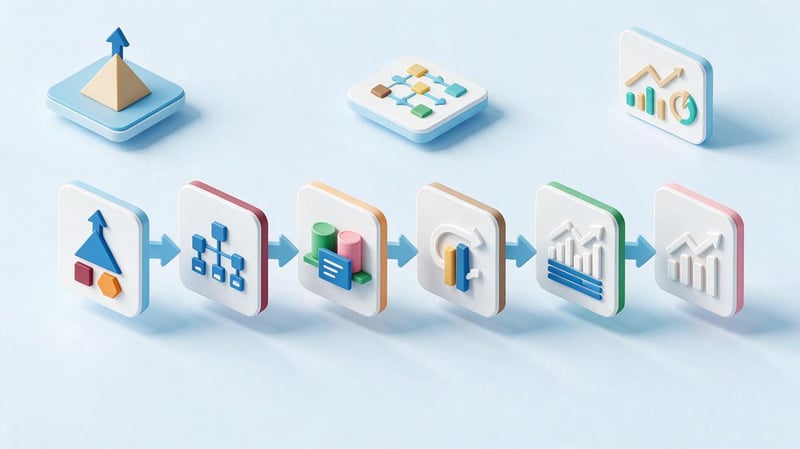
Web analytics from scratch doesn't start with creating a service account, but with defining the tasks. First, you need to decide which visitor actions are important and what questions the reporting should cover. After that, it's easier to choose an analytics system, events, and integrations.
A hasty installation leads to a common problem: data is collected for months, but the required event is missing. To avoid this, it's best to configure it using a Measurement Plan, which defines goals, events, parameters, and verification methods.
Step 1: Define business goals and KPIs
A business goal should be linked to a measurable outcome. For an online store, this could be a purchase and revenue, for a clinic, an appointment, or for B2B, a qualified lead. Secondary actions help understand the user journey, but they don't replace the ultimate goal.
Once the goal is defined, a KPI is selected. If the business is measuring sales, the number of submitted forms alone won't be enough. It will be necessary to link the inquiries to the CRM and understand what percentage of leads are converted into customers.
Step 2: Create a measurement plan
A Measurement Plan defines which actions need to be tracked and why they are needed. It typically includes events, parameters, target actions, data sources, and naming conventions. Each metric should clearly indicate the decision it supports.
The plan might include form submissions, phone clicks, registrations, key block views, adding a product to a cart, and purchases. There's no point in collecting every technically feasible click if the team will never use this data.
Step 3: Install Google Analytics 4
Google Analytics 4 collects website or application data and builds reports based on an event-based model. After creating a property, a tag is installed on the site, then the receipt of events and the main parameters are verified.
Google Web Analytics requires further customization for the project. A basic page_view alone is insufficient if you need to measure inquiries, purchases, or interactions with important elements. Therefore, installing a counter is only one step in the overall process.
Step 4: Set up Google Tag Manager
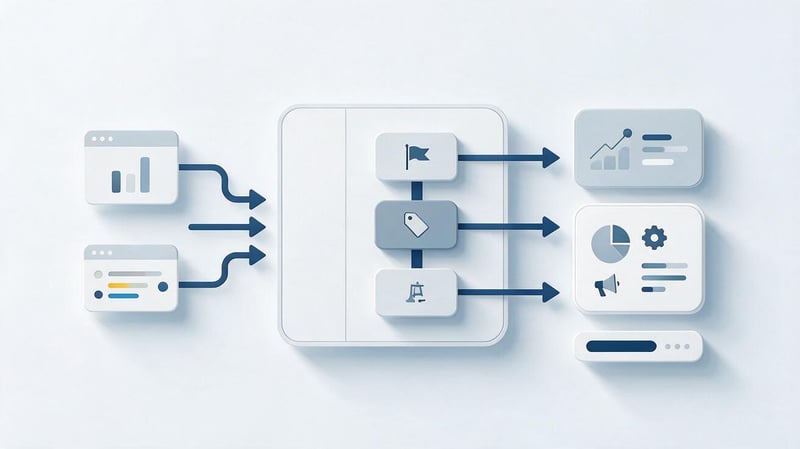
Google Tag Manager helps you manage tags and their trigger conditions. GTM allows you to send events to GA4 and other systems without constantly adding separate scripts directly to your website templates.
GTM and GA4 perform different functions. The former manages tags and data transfer, while the latter stores and analyzes received events. Therefore, web analytics software and tag managers cannot be considered interchangeable services.
Step 5: Set up events and key actions
Events should reflect clear user actions. For a form, you can track successful submission; for a store, you can track adding a product, initiating checkout, and making a purchase. After setup, each event is tested in a real-world scenario.
Significant actions for a business are identified separately as key events. However, a simple button click shouldn't be automatically considered a success if the form may not have been submitted or the purchase may not have been completed.
Step 6. Configure UTM tags and traffic sources
UTM tags are needed for consistent tagging of advertising and external placements. The company pre-defines rules for source, medium, campaign, and other parameters to prevent reports from being split into dozens of variations of a single channel.
Internal website links should not be marked with advertising UTMs. This can change the source information and complicate attribution. For internal actions, it's better to use events and other analytics parameters.
Step 7. Check the accuracy of data collection
After launch, analysts check for duplicate events, missed actions, invalid parameters, internal traffic, and transitions between own domains. For online stores, they check products, currency, price, and order ID separately.
Data quality must be monitored regularly. Changes to the form, CMS, domain, or checkout mechanics can disrupt an event without the marketer noticing, so online web analytics requires periodic technical testing.
Step 8. Set up reports and dashboards
Dashboards are built around working questions. A manager might need overall lead and sales dynamics, a marketer might need channels and acquisition costs, and an SEO specialist might need organic landing pages and target actions.
Data visualization should reduce analysis time. If a report requires a long search for the required indicator among dozens of charts, its structure should be reconsidered. A good report provides context and allows drilling down into details.
Web analytics tools and services
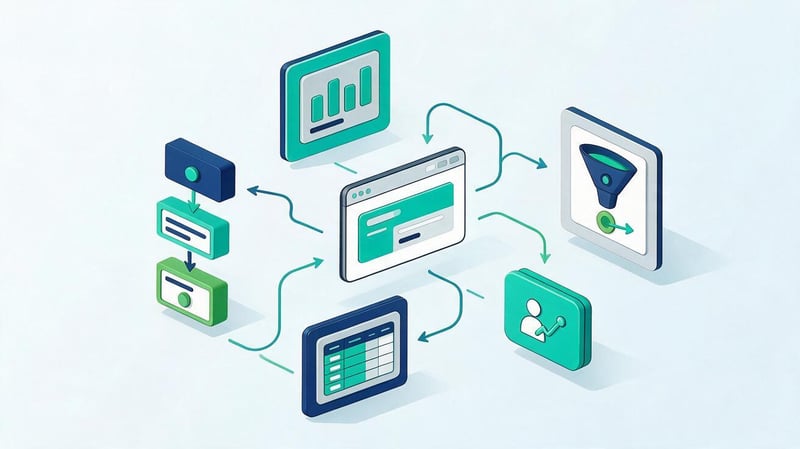
Web analytics services solve different problems, so there's no universal ranking. One service collects events, another helps manage tags, a third visualizes data, and a fourth stores sales data. The choice depends on the project architecture and the team's goals.
Below is a basic set that covers the most common scenarios. Analytical platforms can be replaced with similar ones if they better suit the project's requirements.
| Tool | What is it used for? | When needed |
|---|---|---|
| Google Analytics 4 | Users, events, sources, key actions | For basic web analytics of the site |
| Google Tag Manager | Managing tags and event transmission | When flexible measurement settings are required |
| Google Search Console | Queries, clicks, impressions, search pages | For SEO and organic traffic evaluation |
| Looker Studio | Reports and dashboards | For regular data visualization |
| BigQuery | Storage and processing of raw data | For large projects and complex data joins |
| Behavioral services | Clicks, scrolls, session recordings | For UX analysis and problem finding |
| Matomo | Alternative analytics system | For projects with specific data requirements |
| CRM | Leads, deals, sales, and clients | To connect marketing with business results |
This structure helps separate functions and avoid relying on a single analytics service for everything. For a small website, some tools may be redundant; in that case, GA4, Search Console, and accurate target action tracking are sufficient.
Google Analytics 4
Google Analytics 4 is used to analyze events, audiences, traffic sources, and actions on a website or app. Google Web Analytics is suitable for most basic marketing tasks and integrates with other products in the ecosystem.
Standard reports don't replace a measurement plan. The team first decides which events to send and how to verify them, and then builds the reports. Therefore, the query “Google online website analysis” should be separated from automated SEO audits, as GA4 addresses a different task.
Google Tag Manager
GTM simplifies the management of analytics and advertising tags. It allows you to set trigger conditions, pass event parameters, and maintain a unified measurement logic without multiple, disparate code inserts.
For complex projects, a dataLayer is used, where the site transmits structured data for tags. This scheme requires developer involvement, but makes the setup more stable, especially for e-commerce and dynamic interfaces.
Visualization and BI systems
Looker Studio, Power BI, and other BI systems are used to combine metrics and create reports. They are convenient when data comes from multiple sources and the standard interface of a single system is no longer sufficient.
Analytical tools of this type don't correct errors in the source data. If the CRM contains duplicates or GA4 events are configured incorrectly, a beautiful dashboard will simply display these errors in a more convenient format.
BigQuery
BigQuery is used when working with large volumes of data, storing raw events, and connecting them to other sources. Analysts can use SQL for custom selections, calculations, and segments that are difficult to build in standard reports.
For a small corporate website, such storage may be overkill. Connecting it makes sense when there's a specific task at hand: consolidating first-party data, advanced attribution, complex segmentation, or custom reporting.
Behavioral services
Behavioral services reveal interface interactions that are difficult to understand from a standard event table. Heatmaps, scroll logs, and session recordings help identify elements that users overlook or use differently than the team intended.
Such observations are best viewed as a source of hypotheses. A few unusual sessions don't prove a widespread problem, so the conclusion needs to be tested against data from a wider audience.
How to analyze website performance?
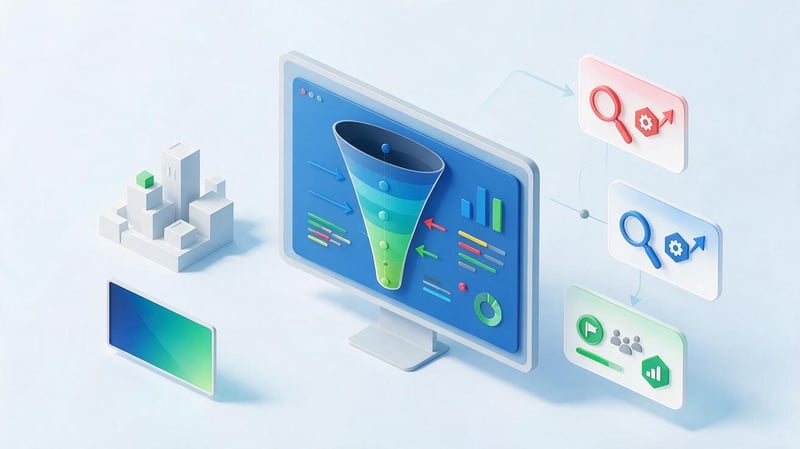
Website performance analysis begins with formulating a question. For example, why have orders declined, which advertising channel is bringing in customers, or why are users abandoning the checkout process. Then, the timeframe, segments, and metrics related specifically to this task are selected.
A universal website analysis program can't provide a ready-made answer without business context. An automated website analysis service can identify technical indicators, but marketing insights require comparing data and causes.
Compare traffic sources
First, they compare the volume and quality of traffic across channels. For each source, they look at users, target actions, conversions, and, if available, cost of acquisition. If necessary, they analyze individual campaigns and landing pages.
This way, you can identify a channel that generates a large volume of visits but achieves almost no results. Alternatively, a small source may consistently generate high-quality leads, making its value higher than its share of traffic suggests.
Find pages with problems
Landing pages and key stages of the user journey are then examined. Particular attention is paid to pages with high traffic but low conversion rates, sharp drops in engagement, or noticeable differences between mobile and desktop users.
Website analysis parameters are selected based on the page's purpose. For an article, subsequent clicks and content consumption are important; for a service page, actions related to the inquiry are important; and for a product page, the movement to the shopping cart and purchase is important.
Analyze the user's path
A user's journey involves multiple interactions that can occur on different days and through different channels. A user might first find an article through search, then return directly, explore the service, and only then submit an inquiry.
The customer journey helps avoid overestimating the last touchpoint before conversion. In complex sales situations, it's helpful to consider the sequence of contacts and consider the limitations of the chosen attribution model.
Find the location of user loss
Let's assume 1,000 users opened a product card, 180 added the item to their cart, 70 initiated checkout, and 30 completed the purchase. This simple funnel graph immediately shows how many users completed each stage.
| Stage | Users | Share of the first stage |
|---|---|---|
| View product | 1,000 | 100% |
| Add to cart | 180 | 18% |
| Checkout start | 70 | 7% |
| Purchase | 30 | 3% |
After this, you need to compare the funnel with previous periods, devices, and sources. If losses only appeared on the mobile version after the checkout update, a specific technical hypothesis emerges for testing.
Form and test a hypothesis
A hypothesis should link the observed problem to a suspected cause and measurable outcome. For example, a long form may be reducing the number of inquiries on mobile devices, so the team reduces the number of optional fields and compares conversion rates.
After implementation, the same metric and a comparable segment are tested. If the metric has changed, the team evaluates the statistical and business significance of the result and then decides whether to maintain the change.
How does web analytics help SEO and internet marketing?
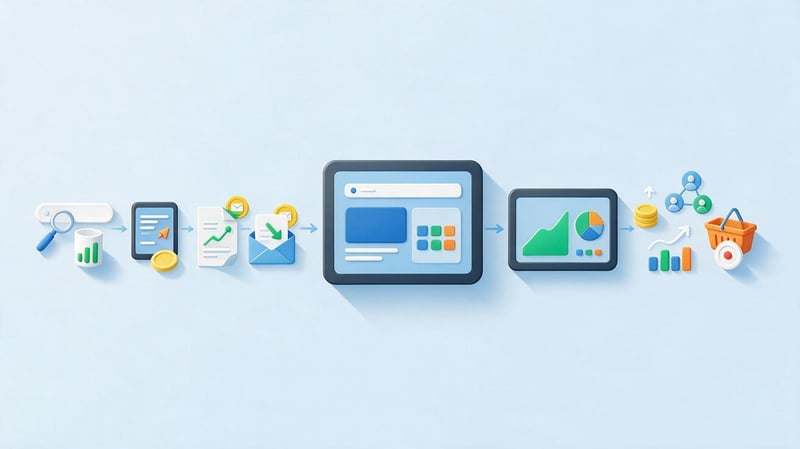
Analytics in online marketing helps compare the results of different channels after a user lands on a website. This is especially useful when working simultaneously with SEO, PPC, content marketing, email, and social media, where a single person may interact with multiple sources.
Web analytics marketing links costs and traffic to subsequent actions. This allows the marketing team to see which pages and campaigns are driving user acquisition, while others are generating visits without any noticeable results.
SEO traffic assessment
For SEO, organic traffic is analyzed by landing pages, content types, and segments. Google Search Console helps you see queries, impressions, and clicks, while GA4 shows subsequent user behavior after clicking.
This way, you can find a page whose search visibility is increasing but conversion remains weak. In other cases, the problem is found earlier: the page is converting existing traffic well but receiving few clicks from search.
Website content analysis
Content is assessed based on its role in the user journey. An informational article may not generate direct sales, but it regularly directs readers to commercial pages or re-engages them through search.
The analysis uses views, engagement, internal clicks, and subsequent target actions. Online resource analysis becomes more useful when similar types of pages are compared with each other, rather than mixed together in a single report.
Advertising evaluation
Advertising is evaluated by linking costs to target actions. CTR and cost per click help monitor individual stages, but the final outcome depends on leads, sales, and the chosen business model.
If a campaign receives many low-cost clicks and generates almost no customers, its effectiveness will be lower than that of a campaign with higher click costs and stable sales. Therefore, marketing analytics tools should take post-visit performance into account.
Landing page analysis
A landing page is evaluated based on the context of the user's search query and source. A page may perform well for a branded audience but significantly worse for cold advertising traffic, so the overall score will mask the differences.
Segmentation helps compare devices, channels, and audiences. The team can then modify the content, CTA, form, or structure of the page and test the impact on conversion.
Who is a web analyst and what do they do?
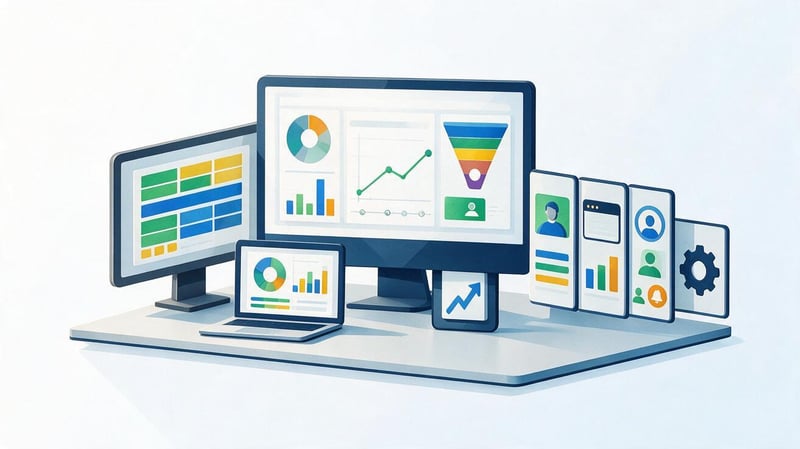
A web analyst is a separate topic within a larger discussion. This specialist is responsible for measurement systems, data verification, reporting, and user behavior analysis. Within a company, their responsibilities may overlap with marketing, product analytics, SEO, and development.
The queries “web analyst what is”, “who is a web analyst”, and “what does a web analyst do” are all related to the profession, so there's no need to detail job openings and career paths in this article. It's sufficient to understand the specialist's role in working with a website.
Main tasks of a web analyst
A web analyst, whose responsibilities vary by company, typically participates in planning measurements, setting up events, and verifying data accuracy. They also build reports, compare segments, identify patterns, and formulate hypotheses for the team.
What a web analyst actually does depends on the scale of the project. In a small company, they might work independently with tags and dashboards, while in a larger organization, some technical tasks are delegated to developers and the data team.
What tools does a web analyst work with?
The core suite often includes Google Analytics 4, Google Tag Manager, Google Search Console, spreadsheets, and a visualization system. For large data volumes, SQL, BigQuery, BI, and CRM are added.
A web analyst must also understand the structure of events, traffic sources, attribution, and business processes. While knowing the analytics software interface is helpful, it's difficult to draw accurate conclusions without understanding the task.
Web analytics errors
Analytics errors aren't just caused by incorrect code. Often, the problem starts earlier: the team hasn't defined goals, is collecting too many events, or is evaluating metrics without context. As a result, reports exist, but decision-making based on them is difficult.
Website analytics systems require regular testing after website and marketing process updates. Changes to the form, domain, CRM, or advertising markup can impact data even if the report configuration remains unchanged.
Collecting data without purpose
The desire to measure everything leads to dozens of events that no one uses. The more unnecessary parameters, the more difficult it is to maintain structure and find the information that's truly needed.
Before adding an event, it's worth asking a simple question: what decision will be made based on this metric? If there's no answer, it's best to leave the event outside the main measurement framework.
Treating any metric as a KPI
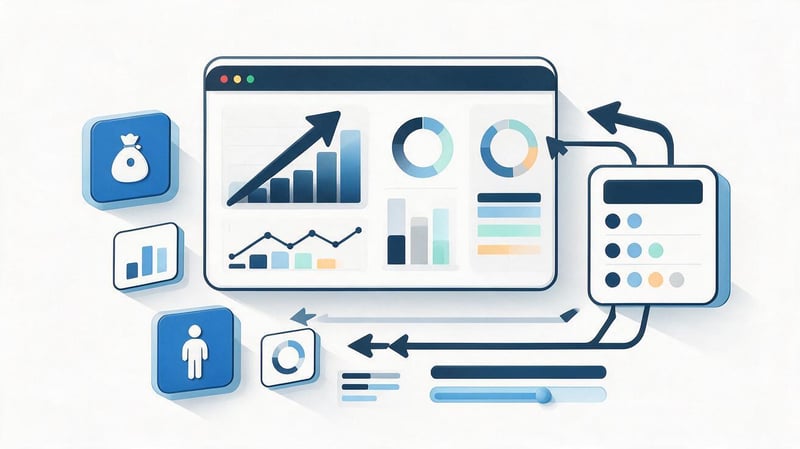
A metric describes a measurable value, while a KPI is linked to a specific goal. Pageviews can be a useful metric, but for a service website, they're rarely the primary performance indicator.
KPIs are selected based on the task and timeframe. For a marketing department, this could be cost per qualified lead, while for an online store, it could be revenue, ROAS, or percentage of completed purchases.
Not checking data quality
Data collection errors can completely alter the conclusion. Submitting a purchase twice will increase the number of purchases, a missed form event will underestimate the number of leads, and an incorrect currency will distort the revenue report.
Testing is performed after implementation and after significant changes to the website. This involves debugging modes, real test scenarios, and verification with the CRM or ordering system.
Evaluating a site only by traffic
The increase in traffic appears positive until you compare it with conversion and audience quality. A website could attract 30% more users from broad information searches, while the number of inquiries remains the same.
For businesses, it's more useful to see the connection between source and result. Therefore, website traffic analysis should be supplemented with target actions and sales metrics.
Ignoring user consent and privacy
Cookie consent and Consent Mode affect what data can be collected and how the analytics system processes it. To manage consent, companies use CMPs and configure tag behavior based on the chosen model.
The rules vary by jurisdiction and project, so the legal framework is determined separately. From an analytical perspective, it's important to understand that data collection limitations may impact the completeness of reports and comparisons across periods.
Analyzing reports without business context
A single metric rarely has a universal interpretation. A drop in sessions can be a problem following a loss of organic rankings, or it can be the expected result of disabling an ineffective advertising campaign.
Analytics, in practical terms, is about working with context, not just automatically interpreting graphs. Before drawing conclusions, it's important to check for changes in marketing, the website, seasonality, and the measurement system itself.
The Essentials of Web Analytics
Web analytics, from A to Z, is built around a single, repeatable cycle: define the goal, collect the necessary data, validate it, analyze the results, and test the change. The more precisely the task is defined, the fewer unnecessary reports the team will need.
For most websites, a basic system can be built using GA4, GTM, Search Console, and accurate tracking of target actions. More complex projects add CRM, call tracking, BI, BigQuery, server-side tagging, and custom data sources when these integrations have a clear business purpose.
Web analytics helps connect website visits with user actions and business results. A working system begins with goals and accurate data collection, followed by reports, dashboards, and insights.
If GA4 is already installed on your website, the next step is to check events, key actions, traffic sources, and whether the data corresponds to actual inquiries or sales. Order a web analytics audit from Seo-Gen to identify measurement errors and receive a clear setup plan.
More articles about SEO Promotion


