Website statistics in Google Analytics 4


Website traffic shows how many people come from search engines, advertising, social media, and other sources. However, the number of visitors doesn't explain how well a website is performing. For a comprehensive analysis, you need to know which pages users view, how long they spend on the site, and what actions they perform.
Google Analytics 4 (GA4) collects website visitor statistics and helps you understand audience behavior. Its reports show traffic sources, popular pages, number of users, sessions, events, and target action results. The system is suitable for online stores, corporate websites, blogs, and small landing pages.
Let's look at how to view website statistics in Google, where the main GA4 reports are located, which metrics deserve attention, and how to use the resulting data for SEO.
How to view website traffic in Google Analytics 4?
To track your own website's traffic, open Google Analytics 4 and select the property associated with the desired domain. In the “Reports” section, you can access data on users, sessions, traffic sources, and pages viewed. Statistics are displayed for the selected period, so you can study visits from yesterday, the last month, or the entire year.
If analytics is already enabled, you don't need to configure additional reports to view statistics for the first time. Simply open the existing data and select the metrics you're interested in. Section names may vary slightly depending on your property settings and published report collections.
How do I open my website statistics in Google?
You can access Google Analytics statistics using the Google account that has been granted access to the property. If analytics is handled by a contractor, the website owner can gain separate access without sharing their account password.
To view website traffic data, follow these steps:
- Go to analytics.google.com and sign in to Google.
- At the top of the interface, select the desired Google Analytics 4 account and property.
- Open the “Reports” section in the side menu.
- Select an overview report or go to detailed visit statistics.
- Set the analysis period and check the values of users, sessions and other metrics.
After opening the report, pay attention to the selected property and date range. If your account contains multiple websites, it's easy to accidentally view statistics for a different project. If you don't see the property you need, check the user permissions and the email address you're logged in with.
In some configurations, the report opens via the “Lifecycle” collection, while others use their own navigation. Google Analytics' built-in search also helps you find the section you need.
Where can I see the number of visitors per day, week, and month?

You can view the number of visitors on the main analytics page and in standard GA4 reports. For more detailed analysis, use the “Traffic Acquisition” and “User Acquisition” sections, which display audience metrics along with referral sources.
A calendar is located in the upper right corner of the report. Select yesterday, the last seven days, the last 28 days, or specify a custom range. If necessary, enable comparison to see the difference between the current and previous periods.
Pay attention to the metric chosen to evaluate traffic. Active users, all users, and sessions answer different questions. A single user may return to a website several times in a month, so the number of sessions is usually different from the number of users.
How to compare traffic over different periods?
Comparing periods helps identify traffic changes that are difficult to detect based on a single value. For example, if a site received 4,200 sessions in September and 5,000 in October, the increase is approximately 19%. After this, it's worth checking which channels contributed to the increase in traffic.
For accurate comparisons, it's advisable to select periods of equal length and take into account calendar factors. If one month included holidays or a promotional event, the change in statistics may be due to these circumstances.
Below is a hypothetical example of changes in website traffic by week.
| Week | Sessions | Dynamics |
|---|---|---|
| First | 820 | Initial period |
| Second | 940 | +14.6% |
| Third | 1,080 | +14.9% |
| Fourth | 1,030 | -4.6% |
This table shows an overall increase in traffic and a slight decline in the last week. To find the cause, you need to open the traffic sources, review the landing pages, and check for changes in search visibility.
How to check website traffic in real time?
The Real-Time report shows visitor activity over the last 30 minutes. The interface also provides user activity data for the last five minutes. This section is useful for testing new settings and tracking reactions to recently published content.
Open “Reports” and find the “Real-Time” section. This screen displays data on active users, their location, pages viewed, and registered events. For example, you can see whether visitors open a new service page after sharing a link on a social network.
To verify your own visit, open the website in a separate tab, navigate to several pages, and refresh the report. Be sure to take analytics blockers, consent settings, and internal traffic filters into account. The absence of a test visit requires further verification of data collection.
Answers to your questions
How to view website statistics in Google for free?
To monitor your website's traffic, you can use the free version of Google Analytics 4. It provides standard reports on users, sessions, traffic sources, pages, and events.
To view the data, you need to connect analytics to your website and access the relevant property. Once the tag is installed, the system will begin recording visits and other configured events.
Additional information about your website's search visibility can be obtained through the free Google Search Console. These services are conveniently used together for SEO analysis.
Is it possible to view someone else's website traffic using Google Analytics?
Accurate statistics for someone else's website in Google Analytics are unavailable without the property owner's permission. If the company grants guest access, you can explore the data within the assigned permissions.
Third-party analytics and SEO services are used to roughly estimate competitors' traffic. These services base their estimates on their own data sources and models, so the results may differ from the website's internal statistics.
When conducting competitive analysis, it's useful to examine visibility, search pages, keywords, and potential traffic sources. However, such information shouldn't be interpreted as a verified number of actual visitors.
How do I find out how many people visited a website in a month?
Open Google Analytics 4, go to Reports, and set the date range to the desired month. Then find the number of users or active users metric.
If you need to know the number of visits, use the sessions metric. A single user can visit a site several times a month, so sessions usually outnumber unique visitors.
For additional analysis, you can compare the current month with the previous one and look at traffic distribution across channels. This will help you understand whether your audience has changed and which sources are driving the majority of visits.
How to view statistics for a specific page in GA4?
Open the “Pages and Screens” report and find the desired page using the search or filter. For analyzing a specific URL, it's easier to use the page path parameter if it's available in the report.
Here you can view views, users, engagement time, and related events. If you want to know how many sessions started on this page, open the “Landing Page” report.
For SEO, additionally isolate Google's organic traffic and compare metrics over several periods. This way, you can assess the dynamics of traffic to your content from search results.
How do I find out how many visitors came from Google?
Open the “Traffic Acquisition” report and select the “Session Source/Medium” parameter. Search for “google/organic” to see sessions from organic Google search.
To analyze paid clicks, relevant advertising traffic sources and channels are used. This requires taking into account the correctness of UTM tagging and advertising system integration settings.
If you need to find out which search queries users used to find your site, use Google Search Console. GA4 provides data on visitor behavior after landing on your site.
Why do Google Analytics and Search Console show different numbers?
Google Search Console tracks clicks on search results, while GA4 calculates sessions based on logged events. Therefore, metrics between the two systems may differ even within the same date range.
For example, a user might click a search result and close the page before the analytics tag has finished loading. Consent settings, blockers, and processing features also affect data collection.
To verify, make sure you're comparing the same pages, countries, devices, and time periods. Don't expect perfect match between clicks and sessions.
How often are Google Analytics 4 statistics updated?
The real-time report displays data shortly after user activity is recorded. This section is useful for checking analytics connectivity and monitoring current visits.
Standard historical reports are updated with a delay, and data processing can take 24–48 hours. During this period, metrics for recent dates sometimes change.
For monthly SEO reporting, it's advisable to analyze already processed data. This reduces the likelihood of discrepancies caused by incomplete statistics updates.
Is it possible to find out website traffic without Google Analytics?
Yes, you can analyze your own website's traffic using other web analytics systems or server logs. However, the range of metrics and analysis capabilities will depend on the tool used.
Google Search Console lets you see the number of clicks from Google search, impressions, CTR, and rankings. However, the service doesn't display all traffic from advertising, social media, and other sources.
If analytics hasn't been set up previously, obtaining a complete history of user activity for past periods is usually impossible. For subsequent analysis, it's best to set up data collection in advance and verify its accuracy.
How to set up Google Analytics 4 to collect website statistics?

If Google Analytics isn't yet connected, you'll first need to create a property and install the tracking tag on your website. After that, GA4 will begin collecting information about visits and user actions. Historical data from before the system was installed won't appear automatically.
To connect, you'll need access to Google Analytics and the ability to manage your website's code or Google Tag Manager container. In some CMSs, analytics is connected via a separate field for the measurement ID, so manually editing the source code is unnecessary.
Creating a GA4 property and data stream
Open Google Analytics and create an account if you don't already have one. Then add a property, specify the site name, time zone, and reporting currency. These settings affect the display of statistics by date and currency.
After creating a property, select the “Web” platform and add a data stream. Enter the website address and stream name, and Google will provide a measurement ID in the format G-XXXXXXXXXX.
This ID is needed to link a website to a specific GA4 data stream. A single property may contain multiple streams, for example, for a website and a mobile app. Before installing the tag, make sure the correct property is selected.
When setting up, also check the advanced tracking. It can automatically record page views, scrolling, some external link clicks, and other events if the relevant settings are enabled.
Connection via Google Tag Manager or Google tag
There are several ways to install Google Analytics on your website. The choice depends on the CMS you use, access to the source code, and the number of marketing tools you use.
Main connection options:
- Google tag. The code is placed on the website pages according to Google's instructions or connected via the CMS's built-in capabilities. Once installed, the tag transmits data to the selected GA4 stream.
- Google Tag Manager. A GTM container is installed on the site, within which the Google tag and additional events are configured. This option is convenient when you need to track forms, buttons, and other actions without constantly changing templates.
After installation, check to see if the same events are being sent through multiple independent settings. For example, sending page_view simultaneously via the built-in CMS integration and a separate tag can lead to inflated view counts.
For a multi-site CMS, it's best to store analytics IDs separately for each site. This simplifies property management and prevents accidental mixing of statistics from different domains.
How to check if data is collected correctly?
After connecting analytics, open your website and perform a few actions: navigate between pages, click a button, and submit a test form if tracking is configured. Then, check what events appear in Google Analytics.
The Real-Time report and the DebugView tool are suitable for initial diagnostics. The former allows you to see current visits, while the latter shows the sequence of events from a device with debug mode enabled.
Additionally, check the internal traffic filter, unwanted referrals, and cross-domain tracking if users are moving between multiple related domains.
If a website uses a consent banner, check that it is working correctly and that its Consent Mode settings are correct. Analytics collection must comply with applicable privacy requirements.
What website statistics metrics are available in GA4?

Google Analytics 4 uses an event-driven data collection model. The system records visits, page views, interactions, and other actions, then calculates metrics for standard and custom reports.
When analyzing traffic, it's important to understand the meaning of each metric. The same number of users may be accompanied by a different number of sessions, page views, and key events. Therefore, it's best to view statistics from several perspectives.
Users, active users and new visitors
The “All Users” metric reflects the number of unique users registered by the system during the selected period. “Active Users” accounts for audiences that meet GA4 activity criteria, while “New Users” refers to first-visit or app-open events.
For example, a person visited the site for the first time on Monday and then returned on Wednesday. Depending on the selected period, they may be counted as a single user, even though they made two visits.
When assessing audience growth, it's helpful to compare new and returning users. For an online store, repeat visits can reflect product selection, while for a blog, they can indicate audience interest in new posts.
It's important to note that user identification depends on analytics settings, available identifiers, and consent to data processing. Therefore, GA4 metrics should not be considered a completely accurate count of all individuals who visited the site.
Sessions and page views
A session is the period of user interaction with a website. It begins when the resource is opened and includes actions recorded until the end of the visit. By default, a session ends after 30 minutes of inactivity, unless this setting is changed.
A page view is recorded using the page_view event. A single session can include multiple such events, for example, when a visitor opens an article, navigates to a service page, and then views contacts.
In Google Analytics statistics for your website, users, sessions, and views help evaluate different aspects of audience behavior. Sessions are most often used to analyze engagement, while page views are used to study content popularity.
Automatic pageview registration in single-page applications should be checked separately. When changing the URL without a full page reload, the event must be sent correctly; otherwise, some user navigation may not be included in the statistics.
Why are there more page views than visitors?
A single user can open multiple pages in a single visit and return to the same content multiple times. Each registered pageview event increases the corresponding metric, while the number of unique users is calculated separately.
Let's say a visitor opens the main page, reads an article, and then navigates to a service description. They then return to the article and refresh it. The statistics will show additional views, even though all actions were performed by the same person.
A high number of views sometimes indicates interest in the content, but other explanations are also possible. For example, poor navigation forces visitors to reopen pages in search of the information they need.
Therefore, views should be evaluated alongside sessions, engagement time, navigation paths, and key events. A standalone value rarely provides insight into the quality of the user experience.
Engagement and bounce rate

In GA4, engagement is measured through user actions and activity. One of the key metrics is the share of sessions with interaction, or the ratio of such sessions to the total number of visits.
A session is considered engaged if at least one condition is met: it lasts more than 10 seconds, contains a key event, or includes at least two pageviews or screen views. Bounce rate is calculated as the proportion of sessions that do not meet these conditions.
For example, a visitor reads a short answer to a question and then closes the page. If the session was short and didn't involve key events, the system may consider it a bounce, even if the user received the necessary information.
For analysis, it's also useful to look at average interaction time and the behavior of individual audience segments. There's no universal bounce rate for all types of websites, so comparisons are best made between similar pages and comparable traffic sources.
Events, Key Events, and Conversions
Every significant user action in GA4 can be recorded as an event. Some events are collected automatically, while others require separate configuration via website code, Google Tag Manager, or CMS capabilities.
Examples of events encountered during website analysis:
| Event | What is recorded |
|---|---|
| page_view | Viewing a web page |
| scroll | Reaching the set scroll threshold |
| file_download | Downloading a file using a tracked link |
| form_submit | Submitting a form when configured accordingly |
| purchase | Purchasing with e-commerce tracking enabled |
Not every event automatically confirms the successful completion of an action. For example, for a form, it's best to check for actual confirmation of submission, and for a purchase, to check for the receipt of correct order data.
The most important events can be designated as key events. For a commercial website, these could be confirmed leads, registrations, or paid orders. These events are used to evaluate the performance of channels and pages.
When working with advertising, you should check your Google Ads conversion settings separately. Their attribution, calculation methods, and available metrics may differ from GA4 key events.
Google Analytics 4 Key Reports for Website Analysis

GA4's standard reports help you quickly find answers to questions about traffic, referral sources, and audience behavior. A few sections are usually sufficient for daily analysis, so exploring all the system's capabilities is unnecessary.
The available reports depend on the property settings and published collections. If the desired item is not available in the side menu, use the search or ask the property editor to add the appropriate report through the library.
| Report | Data shown | Used for |
|---|---|---|
| Traffic acquisition | Sessions, channels, referral sources | Analysis of SEO, advertising and other channels |
| User acquisition | Sources of initial audience acquisition | Evaluation of channels for attracting new users |
| Pages and screens | Individual page views and metrics | Content popularity analysis |
| Landing page | Session start pages | Landing page evaluation |
| Events | Registered interactions | Checking visitor actions |
| Tech details | Devices, browsers and systems | Troubleshooting technical issues |
| Demographic data | Available geography and audience characteristics | Audience research |
| Monetization | Purchases, goods and income | E-commerce analysis |
| Retention | Repeated user activity | Audience return assessment |
For SEO, the most useful reports are those on traffic acquisition, landing pages, and user actions. They help you see which content is receiving visits from search engines and how this audience interacts with the site.
Traffic Acquisition Report
The “Traffic Acquisition” report shows which channels users use to reach your site during specific sessions. It includes organic search, paid advertising, social media, direct visits, and referrals from other websites.
Session, engagement, and key event metrics are available for each source. This allows you to compare the performance of different channels over the same period and determine which ones are driving the most engaged visitors.
For example, ads may drive more sessions than SEO, but organic visitors may view commercial pages more often. The conclusion depends on the specific data, so it's best to compare similarly configured key events.
The report is also useful for diagnosing changes. If traffic has dropped sharply, first check which channel is losing traffic, and then move on to a more detailed analysis of individual pages.
How to determine the sources of website visits?
To view sources, open “Traffic Acquisition” and select the appropriate table option. Commonly used options are “Primary Session Channel Group” and “Session Source/Medium”.
The second parameter helps identify the specific source along with the traffic type. For example, google/organic denotes traffic from regular Google search results, while google/cpc is typically associated with tagged paid traffic.
The value direct / (none) means the session is attributed to direct traffic. This doesn't always prove that a person manually typed the website address, as the source is sometimes technically impossible to determine.
For accurate attribution of email campaigns and individual ad campaigns, use consistent UTM tags. Incorrect UTM tags can result in extra rows in reports and complicate comparisons of results.
How is user acquisition different from traffic acquisition?
The User Acquisition report analyzes the sources of a user's first recorded interaction. Traffic Acquisition shows the sources of specific sessions, including repeat visits.
Let's imagine a person first found your site through an organic Google search and then returned a few days later via a link from a newsletter. In the first acquisition report, the original channel will remain the primary source, while the sessions report will show data on the return visit.
Therefore, it's more convenient to use session metrics to compare current traffic sources. If the goal is to determine where new users are coming from, it's more useful to study first-time acquisition data.
When evaluating marketing, both reports complement each other. They help consider the role of different channels across multiple visits without confusing their purposes.
Pages and Screens Report

The “Pages and Screens” report shows which content visitors view most often. It lets you analyze views, users, interaction time, and content-related events.
For a site with multiple language versions, it's useful to select the page path parameter. This allows you to separately study URL statistics for different language prefixes and compare audience interest in localized content.
If an article receives a lot of views, check where visitors came from and whether they continued exploring other sections of the site. High popularity of the material does not guarantee conversions to commercial offers.
For a more precise analysis of individual URLs, use filters and additional parameters. Also, check whether the same page's data is split between multiple URL variations with parameters.
Landing Page Report
A landing page is the page where a user's session began. The report shows these entry points and their associated traffic and interaction metrics.
For example, a visitor came from Google to a blog article, then opened a service page and submitted a request. In the landing page report, the starting point of this session will be the article, even though the user later visited other sections.
This report is especially useful for SEO, as a significant portion of organic traffic comes directly to internal pages. It can be used to identify content that attracts new visitors from search results.
When analyzing, check sessions, engagement, and key events. Compare pages with similar purposes, as the results of an informational article and a checkout page often differ.
Event and Key Action Reports
Event reports allow you to understand what actions users performed. Here you can study views, scrolling, link clicks, form interactions, and other events collected by a specific property.
For a commercial website, it's useful to set up tracking for successful lead form submissions, registrations, and completed purchases. If events are marked as key events, they can be used when analyzing the performance of traffic sources.
Let's say a website received 3,000 organic sessions and registered 45 successful form submissions in a month. These metrics help evaluate how effectively the organic audience is completing target actions.
It's important to check your event settings. Resending the same event or registering a button click instead of actual success can distort your analytics results.
Visitor Technical Characteristics Report

Technical reports show which devices, browsers, and operating systems the audience uses. For a website, the device category is especially useful: desktop, mobile, or tablet.
If mobile visitors are significantly less likely to submit requests, it's important to check the user experience. Potential issues include buttons that are too small, long forms, overlapping elements, and slow page loading.
It's also useful to compare individual browsers. Sometimes a technical error only appears in a specific browser version and goes unnoticed during a developer's routine website check.
However, a statistical difference alone does not prove the presence of an error. Confirmation will require testing the site on relevant devices and verifying real user scenarios.
Demographic data reports
Demographic reports help study user geography and available audience characteristics. For regional companies, the countries and cities from which visitors come are especially important.
For example, a clinic operates in Dnipro and focuses on local patients. In this case, it's useful to compare visits from the target region with those from other cities and check where the inquiries come from.
Some demographic data may be missing due to privacy settings, missing permissions, or reporting thresholds. Therefore, small audience segments may not be fully visible.
If your business operates in multiple regions, it's worth comparing geographic reports with landing pages and referral sources. This will help you determine how well your actual audience fits within the target market.
Monetization reports
Monetization reports are primarily designed for websites that track purchases and other monetary transactions. They show revenue, products, transactions, and e-commerce metrics.
To obtain reliable sales statistics, it's necessary to correctly transmit purchase events, transaction IDs, product prices, and currencies. Simply connecting a standard GA4 tag is not enough for comprehensive order analysis.
For example, an online store might compare product category traffic with actual sales. If product pages are actively viewed but sales are low, it might be worth checking the price, product availability, and checkout ease.
To accurately calculate revenue, it's necessary to exclude duplicate transactions and process refunds. It's advisable to periodically reconcile GA4 data with orders in the CMS or sales accounting system.
User Retention Reports
Retention reports show how often users return to a website after their first visit. This data is useful for projects where user interaction continues over several days or weeks.
For an online store, repeat visits may be related to product selection, anticipation of a discount, or a new purchase. For an informational project, they help assess whether readers return to your publications.
When analyzing retention, it's important to consider the specifics of your business. A visitor to an emergency medical service website can resolve their issue in a single visit, and a lack of regular return visits doesn't necessarily indicate a problem.
Retention metrics are best compared to the behavior of specific user groups and key events. This helps understand how repeat activity relates to the site's actual goals.
What types of reports are available in Google Analytics 4?
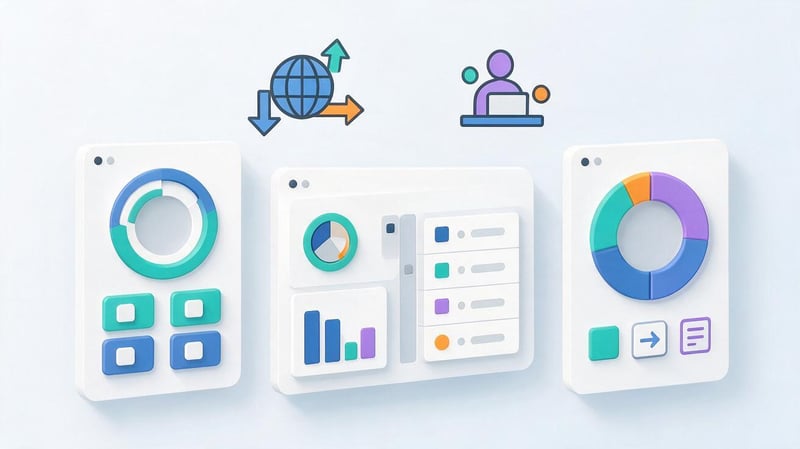
GA4 offers several ways to present statistics. Overview reports show summary metrics, detailed reports break down data into tables, and explorations provide more opportunities to analyze specific segments and user scenarios.
The choice of format depends on the task at hand. Standard statistics are sufficient for daily traffic monitoring, but identifying the causes of declining leads may require additional measurements and filters.
Overview reports
The overview report contains a set of cards with key metrics and charts. It helps you quickly assess changes in traffic, traffic sources, and user behavior without switching between multiple tables.
For example, a single overview can include information on the number of active users, popular pages, and key events. This format is convenient for business owners who regularly review overall website performance.
The set of cards depends on the property configuration. Users with the appropriate permissions can create their own overview reports and add the required metrics.
For a detailed analysis of a specific issue, you usually need to go to the original report. Additional parameters, filters, and more detailed statistics are available there.
Detailed reports
The detailed report includes a table and charts that help you explore statistics based on selected parameters. You can analyze channels, pages, devices, and other user traffic characteristics.
For example, if you want to compare website traffic by device, select device category as a parameter. Then, check sessions, engagement, and key events for mobile and desktop users.
Depending on your permissions, you can edit metrics, filters, and charts. Report structure customization is available to Google Analytics editors and administrators.
Detailed reports are suitable for recurring analytical tasks. Saved configurations are convenient for monthly use, ensuring comparisons are performed using the same methodology.
GA4 Explorations
The “Explore” section is designed for more flexible data analysis. It allows you to create custom tables, audience segments, funnels, and visualizations of action sequences.
Main exploration techniques:
- Free form. Allows you to combine parameters and metrics in a table, compare segments, and apply filters to selected data.
- Funnel exploration. Shows how users progress through specified stages, such as from viewing a product to confirming a purchase.
- Path exploration. Helps you see the sequence of events and transitions that occur before or after a selected action.
- Segment overlap. Used to compare audiences that meet multiple conditions simultaneously.
- Cohort exploration. Helps study the behavior of user groups united by a common initial action or period.
Analysis requires a clear question and properly configured events. If the system doesn't collect the necessary information, the exploration won't be able to reconstruct missing user actions.
When is a standard report not enough?
Standard reports are great for checking overall traffic, but sometimes it's necessary to combine metrics that aren't presented together. For example, an SEO specialist might want to compare the performance of organic landing pages separately for smartphones and desktops.
In the exploration, you can select landing pages, add device categories, session metrics, and key events. The data is then grouped in a table, making it easier to spot differences between selected segments.
Another example is checkout analysis. With configured events, funnel analysis will show how many users reached the cart, initiated checkout, and completed the purchase.
Such explorations help formulate hypotheses about the causes of losses. To draw a final conclusion, user behavior and the technical condition of the relevant pages should be further examined.
How to view Google organic traffic statistics?

Organic traffic is visits that the system attributes to clicks from unpaid search results. For SEO, it's important to distinguish this traffic from advertising and direct clicks in order to evaluate the results of website optimization.
Google Analytics 4 lets you analyze organic sessions, their sources, landing pages, and key events. To analyze search queries, impressions, and rankings, you'll also need Google Search Console.
How to isolate clicks from Google search?
Open the “Traffic Acquisition” report and select the “Session Source/Medium” parameter. Find the “google/organic” row, which corresponds to sessions attributed to Google organic search.
To exclude other sources, apply a filter or compare by session source and medium. Then, check the number of sessions, engagement metrics, and key events.
If you select only the Organic Search channel, your statistics may include traffic from multiple search engines. Therefore, when analyzing Google specifically, it's important to use the appropriate source.
When comparing SEO results, keep the same filtering criteria. Otherwise, changing report settings may create the impression of an increase or decrease in traffic without actually changing search traffic.
How to determine the most visited pages from search?
To analyze your SEO pages, open the “Landing Page” report and select sessions with the google/organic source. Then sort the rows by visits to see the URLs that attract the most organic traffic.
Additionally, examine engagement and key events. For example, a page may attract many users from search but rarely lead them to view the sales section.
Pay attention to changes in the statistics of specific URLs. Even if overall organic traffic is growing, individual important pages may still be losing visits, and such changes can be easily missed in the summary report.
For a multilingual website, it's useful to compare pages in different language versions separately. This helps identify differences in search engine performance between content targeted at different audiences.
How to link Google Search Console to GA4?
Google Search Console shows how a site appears in Google search results. The system provides search queries, impressions, clicks, average CTR, and average position. This information complements Google Analytics traffic statistics.
To link services, open the GA4 property's administrative settings and find the Google product links section. Select Search Console, the desired website property, and the web data stream, then confirm the link.
To connect, you need the appropriate permissions in both systems. Once configured, reports on organic search queries and Google search traffic become available.
A Search Console collection may not appear in the sidebar by default. In this case, a user with editor or administrator rights can publish it through the Reports library.
Lead SEO specialist — Gennady
When I analyze website statistics in Google Analytics 4, I first look at traffic sources, landing pages, and key events. An increase in traffic alone doesn't necessarily indicate SEO effectiveness. For example, an informational article might receive thousands of clicks from Google but drive virtually no traffic to commercial pages.
That's why I always compare GA4 data with Google Search Console: I check search queries, clicks, landing pages, and subsequent visitor actions. This way, I can understand which materials are truly helping the business and which require further development.
Why don't Search Console clicks equal GA4 sessions?
Google Search Console counts clicks on search results, while Google Analytics records sessions using its own measurement system. Therefore, even when analyzing the same website over the same period, the values may vary.
For example, a user clicked on a search result but closed the page before analytics loaded. Search Console might register the click, but the corresponding session won't appear in GA4.
The difference is also affected by blockers, consent settings, time zones, data processing, and repeat visit registration features. Furthermore, sessions and clicks have different counting rules.
If a discrepancy is detected, first check the correctness of the integration and the similarity of the compared data. Don't expect complete agreement between the two systems.
How to create a custom report in GA4?

Google Analytics' ready-made reports cover the basic tasks of traffic analysis, but for regular work, a custom structure is sometimes required. For example, you can collect statistics on organic landing pages and add metrics related to leads.
GA4 allows you to customize detailed reports and create explorations. Their capabilities vary, so it's best to choose the method based on the required parameters, presentation format, and available permissions.
Setting up a detailed report
To create your own detailed report, open “Reports”, then go to “Library”. Choose to create a detailed report and use a suitable template or start with a blank one.
In the settings, you can change dimensions, metrics, filters, and charts. For example, you can add sessions, active users, and key events, and select the landing page as the primary dimension.
Once saved, the report appears in the library. To display it in the sidebar for other users, it must be included in the published collection.
Editing the structure requires editor or administrator rights. If the settings icon is missing, check your permissions instead of attempting to edit the report through other sections.
Creating a free-form exploration
For more flexible customization, open “Explorations” and create a free-form exploration. Add the required dimensions and metrics, then arrange them in the table's rows, columns, and values.
For example, you can generate an SEO analysis report with the following settings:
- Rows: Site landing pages to compare individual URLs.
- Columns: Device categories to separate mobile and desktop traffic.
- Values: sessions, active users, and available key event metrics.
- Filters: Session source and medium matching Google organic search.
After setting up, check the compatibility of the selected parameters and metrics. Some combinations are unavailable in GA4 or require a different analysis method.
This type of exploration is useful for regularly evaluating SEO pages. It shows where traffic is changing and which user groups exhibit distinct behavior.
Export and transfer of statistics
Completed Google Analytics reports can be saved and shared with other team members, depending on their access rights. Export methods provided by the interface are available for further data processing.
If you need to regularly display traffic, leads, and channel dynamics to your manager, it's convenient to create a separate dashboard in Looker Studio. It can receive GA4 data and display it in tables and graphs.
For example, a single dashboard page can display organic sessions, popular landing pages, and key event trends. This data can be supplemented with Search Console data if needed.
For a small website, standard reports without additional visualizations are often sufficient. Complex dashboards are justified when there are multiple data sources and regular reporting tasks.
How to use Google Analytics statistics to improve your website?

The most useful result of analysis is understanding what changes to test on the website. Statistics show traffic, engagement, and registered actions, but the reasons for user behavior need to be investigated separately.
When working with data, it's best to move from the detected change to a testable hypothesis. For example, if traffic has increased but the number of leads has remained the same, it's necessary to examine the sources of new sessions and landing pages.
Analysis of pages with high traffic and low number of leads
A popular page can receive a lot of organic traffic while generating a small number of inquiries. This behavior is common with informational content that answers user questions without the direct intent to book a service.
To check, open your landing page statistics and compare sessions, engagement, and key events. Then, examine the page content, placement of service links, calls to action, and the usability of the contact form.
If a user is looking for instructions, an aggressive sales block can be distracting. Sometimes it's better to add a contextual link to a related service or detailed information that helps them continue solving the problem.
When analyzing, it's important to consider search intent. The number of leads from an informational article should generally not be compared directly to the results of a commercial landing page.
Finding pages with declining organic traffic
If Google traffic has decreased, first determine the scale of the change and the affected pages. To do this, compare the same periods in GA4 and isolate sessions from organic search.
Then open Google Search Console and check the dynamics of clicks, impressions, CTR, and average position. If impressions and clicks have dropped simultaneously, it's worth investigating changes in search visibility and demand.
If impressions hold steady but clicks have decreased, check your rankings, snippets, and search results for changes. If Search Console statistics are stable but GA4 statistics are declining, you should also check analytics data collection.
Not every decline indicates an SEO issue. Traffic is impacted by seasonality, holidays, advertising activity, and changes in user demand.
Analyzing the effectiveness of blog content
Google Analytics statistics help you understand which articles engage your audience and what readers do after viewing them. To do this, you need to analyze landing pages, referral sources, and recorded actions.
For example, an article about setting up analytics might attract specialists who need additional assistance with technical audits. If the article receives visits, but users rarely click on related services, you might want to check your internal linking.
To evaluate the effectiveness of content, it is useful to use the following benchmarks:
| Signal in statistics | What to check | Possible action |
|---|---|---|
| Organic traffic is growing, but there are few leads | Intent and path to service | Improve topic transitions and CTAs |
| Mobile users perform key actions less frequently | Forms, speed, interface | Check mobile version |
| A popular article is losing traffic | Queries, rankings, relevance | Update the material after analysis |
| Lots of views, few clicks | Navigation and interlinking | Add useful internal links |
| Form events have dropped sharply | Form and tracking operation | Check your website and analytics settings |
Any change should be evaluated after implementation, using comparable periods. If traffic and the number of confirmed requests increase after the page is improved, this may indicate improved results.
Why doesn't Google Analytics show website visits?

Lack of statistics is sometimes due to connection errors, property settings, or data processing delays. Before reinstalling the tag, it's worth checking several common causes.
To diagnose this, start with a simple test: open the website, perform a few actions, and check the real-time report. If the visit doesn't show up, move on to checking the tags and data collection parameters.
The tag is not installed or is not working correctly
The most common technical reason for missing statistics is an incorrect Google tag installation or an error in Google Tag Manager settings. The tag may be missing on some pages, use an invalid measurement ID, or fail to fire due to activation conditions.
Check your website code, CMS settings, and the published version of the GTM container. Google Tag Assistant and Google Tag Manager preview mode can be used for diagnostics.
If your site has recently been moved to a different domain or templates have been updated, make sure tracking is still active. Pay particular attention to pages with individual templates, forms, and the checkout process.
After fixing the issue, repeat the test steps and check for event ingestion. Historical visits that weren't registered due to a missing tag are usually impossible to recover using GA4.
The data has not yet been processed
Google Analytics doesn't process data for standard reports instantly. According to Google's help page, full processing can take 24-48 hours, and values for recent periods are subject to change.
Therefore, the absence of today's events in a regular report doesn't necessarily mean that analytics has stopped working. To check current data collection, it's best to use Realtime or DebugView.
If events are visible in the real-time report but not in the historical statistics, first wait for processing to complete. If no data is seen for a long time, check your filters, permissions, and stream settings.
When analyzing daily metrics, consider the property's time zone. It determines the boundaries of the reporting day and can explain differences from other statistical systems.
Incorrect property or date range selected
Sometimes statistics are missing due to a different GA4 property being selected. This situation is especially common among agencies and companies that manage multiple websites through a single Google account.
Open the property selection menu and check the site name and data stream ID. Then, ensure the selected date range includes the period when analytics was already enabled.
Also, check your active filters and comparisons. If a report contains a narrow audience segment, some statistics may be hidden from the current view.
For an initial check, it's best to open a standard report without any additional conditions. Once you've confirmed the data's availability, you can gradually add the necessary filters.
Statistics are affected by filters, user consent, and blockers
Some visits may not be visible in Google Analytics due to data collection limitations. This is influenced by tracking blockers, browser settings, and the user's chosen consent mode.
Internal traffic filters and exclusions configured by the property administrator also affect the results. For example, visits by company employees may be specifically excluded from regular reports.
Before changing filters, test how they work and what data they affect. Some processing settings can affect subsequent statistics, so it's not recommended to apply them without testing.
If necessary, compare GA4 metrics with server logs and Google Search Console. Differences between data sources are expected, as they use different measurement methods.
Google Analytics 4 helps you understand how many users visit your site, where they come from, and what actions they perform. For regular analysis, just start with reports on traffic acquisition, landing pages, and key events.
To evaluate SEO, supplement GA4 data with Google Search Console statistics. Compare organic visits, search queries, popular pages, and confirmed inquiries to make decisions based on actual metrics.
If you need to verify the accuracy of your analytics, set up events, and understand the effectiveness of your organic traffic, contact the Seo-Gen specialists. We'll conduct an SEO audit, review your statistics collection, and prepare recommendations for website improvement.


