Google Tag Assistant: Preview and Debug in GTM


It's best to test changes in Google Tag Manager before publishing the container. Even a tag that appears to be configured correctly may fire twice, trigger on the wrong event, receive an empty variable, or pass an incorrect parameter to Google Analytics 4. Preview Mode and Google Tag Assistant help you spot such errors during testing before they affect live data.
The test is built around a specific user scenario. The specialist opens the site via Preview, performs the required action, and sees what event occurred, what trigger fired, what values were assigned to Variables, and what was added to the Data Layer. For analysts, this is usually enough to understand the cause of the problem before publishing a new version of the container.
Google Tag Assistant is used as the main diagnostic window. It allows you to view events detected by Google tags and GTM container IDs, sent hits, data layer changes, and page navigation history. If an event should be reported to GA4, the final check can be easily completed using GA4 DebugView.
What are Preview, Debug, and Google Tag Assistant in GTM?
Preview, Debug, and Tag Assistant refer to the same testing process but refer to different parts of it. Preview launches a preview of the current working version of the container, Debug displays technical data about the events that occur, and Tag Assistant provides an interface for a specialist to analyze the test results.
This approach is especially useful before changing conversions, ecommerce events, form tracking, clicks, phone numbers, and other actions that influence reports or advertising campaigns. An error in a single trigger condition can change statistics immediately after publication, so diagnostics are performed using specific scenarios.
What is Preview mode in Google Tag Manager?
Preview Mode is launched from the Google Tag Manager workspace and opens the current version of the container for testing. There's no need to publish changes first. A specialist can test a new tag or trigger while regular site visitors are still using the published version of the container.
To launch, open the desired Workspace and select Preview. GTM then opens Google Tag Assistant, where you enter the URL of the page being tested. Once connected, you can navigate the site, click buttons, submit forms, and perform other actions that trigger configured events. Google uses this exact sequence in its current tag verification instructions.
Preview is also useful because it shows how related settings work together. If a custom event occurs but the required tag doesn't fire, the cause can be found in the Triggering conditions. If the tag fires but the parameter is empty, the Variables and event data are checked. This analysis is faster than a typical check using only final analytics reports.
What is Debug Mode?
Debug Mode displays the technical sequence of actions within a test session. It displays page load events, user events, tag firings, transferred data, and other elements involved in processing the current scenario. Regular site visitors don't see this service information.
This mode is especially useful when setting up complex chains. For example, submitting a form might first write data to the Data Layer, then create a custom event, activate a trigger, and only then fire a GA4 Event Tag. If the chain is interrupted, Debug helps pinpoint the specific step where the expected data stops appearing.
Debug shouldn't be considered a standalone replacement for Preview. In a typical workflow, a specialist launches Preview, connects a site via Tag Assistant, and receives diagnostic information within that session. After checking, the session can be stopped and the user can proceed to correcting the configuration or publishing the container.
What is Google Tag Assistant for?
Google Tag Assistant shows which Google tags were detected on the page and what happened to them during the test session. It allows you to check for GTM, access detailed diagnostics, view events, and understand what data was sent for the selected Google tag or container.
The tool helps identify common issues: missing tags, duplicates, misconfigurations, erroneous data transfers, or situations where a user action doesn't trigger the expected event at all. The current extension also displays Google tags found on the current page in the browser's sidebar.
When checking, you need to look beyond the presence of GTM. The mere fact that gtm.js loads doesn't yet confirm that the analytics are working correctly. It's important to run the required user scenario and compare the event, trigger, tag state, variable values, and the actual parameters sent.
Answers to your questions
Do I need to download Google Tag Assistant?
To launch regular Preview Mode, installing the extension separately is not a required first step. Google Tag Manager opens the Tag Assistant web interface after clicking Preview, where you can enter the URL and start a debug session.
The Chrome extension is useful for regular diagnostics and provides additional features for iframes, new tabs, and multiple windows. If your request is related to “Google Tag Assistant download”, you should install the latest official extension from the Chrome Web Store, not the older Companion extension.
How to install Google Tag Assistant?
Open the Chrome Web Store and install the official Google Tag Assistant extension. After installation, open the desired page and launch the extension from the Chrome toolbar. The sidebar will display detected Google tags and buttons for further diagnostics.
If Tag Assistant can't access the page, check the extension's permissions for the current domain. On corporate devices, installation or access to add-ons is sometimes restricted by administrator policies, so this should also be considered when troubleshooting.
Does Google Tag Assistant work in Safari?
You can use the Tag Assistant web interface for the standard Preview, but Google's official browser extension is designed for Chrome. A separate, up-to-date extension for Safari isn't offered in Google's official documentation.
If you need to troubleshoot an iframe, multiple windows, or pop-up, it's more convenient to perform a technical check using Chrome with an extension. The website's behavior in Safari should be tested separately if the browser is part of the project's intended audience.
How to use Google Tag Assistant to check GTM?
Launch Preview in the desired GTM container, enter the page address, and click Connect. Then perform a test action on the site and return to Tag Assistant, where you'll need to find the corresponding event and select the correct container.
After this, check the Tags Fired, trigger conditions, Variables, Data Layer, and sent hits. If the event is related to GA4, additionally find it in DebugView and ensure that the name and required parameters arrived without duplicates.
Why won't Google Tag Assistant connect?
This could be due to a missing Google tag on the selected page, late container loading, multiple redirects, an ad blocker, or insufficient extension permissions. The iframe, CSP, and user consent management system are checked separately.
If the page is broken by an added debug signal, disable the “Include debug signal in the URL” option and reconnect. If the container is delayed in loading, retrying after the page has fully loaded helps.
What do Tags Fired and Tags Not Fired mean?
Tags Fired contains tags that met the trigger conditions for the selected event. After this, you need to check the parameters and the hit sent, because the fact that the tag was fired does not confirm the correctness of the transmitted data.
Tags Not Fired displays available tags whose conditions haven't been met at this time. If the expected tag is found there, compare the Triggering value with the Variables values to ensure the correct event is being analyzed.
Is it possible to test GTM before publishing a container?
Yes, Preview Mode is used to test the working version of a container before publishing it. You can test new tags, triggers, and variables while regular site users continue to receive the previously published version.
After fixing the errors, the scenario should be repeated. Only when events, tags, and transmitted data work as expected should the changes be published via Submit with a clear name and description of the new version.
Do I need to download Google Tag Assistant?

Google Tag Assistant exists in two related versions: as a web interface for debug sessions and as a Chrome extension. Therefore, the request “google tag assistant download” doesn't always mean that preview mode won't work without installing the extension. Preview from Google Tag Manager automatically opens the Tag Assistant interface and prompts you to connect the website you're testing.
This extension is convenient for continuous work with tags. It displays detected Google tags directly in the browser and opens advanced diagnostics via the Troubleshoot tag. Google recommends it for scenarios involving iframes, new windows, multiple tabs, and other situations where a regular web session may not be sufficient.
In 2026, it's best to use the current, combined version of the extension. Older materials may mention Tag Assistant Legacy and Tag Assistant Companion separately, but Google has already combined their features into a single Tag Assistant extension for Chrome. Keep this in mind when searching for instructions and screenshots.
Where can I download Google Tag Assistant?
The current extension is installed from the Chrome Web Store. There's no need to search for third-party builds, extension archives, or manual installation files. After installation, Tag Assistant appears among Chrome extensions and can open a sidebar with tags found on the current page.
Before installing, it's a good idea to check the publisher and extension name, especially if you're not navigating from the official Google Help page. Older versions of content may link to Legacy or Companion, although Google currently describes the Tag Assistant extension as the primary option for Chrome.
For a one-time GTM check, users can start directly from the Preview button inside the container. If diagnostics are performed regularly, installing the extension saves time and opens up additional capabilities for sites with complex transitions, iframes, and multiple windows.
How to install Google Tag Assistant?
To install Google Tag Assistant, open the Chrome Web Store, find the official extension, and add it to your browser. After installation, open the desired website and click the Tag Assistant icon. A panel will appear on the right, showing the Google tags found on the page and accessing detailed diagnostics.
If an extension should only work on specific domains, check its permissions for the sites. Lack of permission to read the current page's data can sometimes cause a tag to be installed but the extension can't see it. For enterprise Chrome, installing extensions may also be restricted by organizational policies.
The sidebar provides options for installing or troubleshooting a tag. The “Troubleshoot tag” button opens tagassistant.google.com and starts a debug session, where you can view the sequence of events and the data being sent. This procedure is described in the latest Google Help.
Do I need to install Tag Assistant Companion?
Tag Assistant Companion is not required for a new installation. Google has combined the features of Tag Assistant Legacy and Companion into a single Tag Assistant extension. If the old instructions suggest installing Companion separately to connect the site to the debug window, this part of the instructions should be verified with the current interface.
Companion can still be found on older computers, in articles from previous years, and in screenshots from experts. This explains the confusion when users see different names for tools for the same task. Google indicates that the unified extension replaces the previous scheme with two separate add-ons.
Manually uninstalling the legacy version just for the sake of updating is usually unnecessary, as Google is migrating it to the new version. For new settings, it's best to focus on the current Tag Assistant and the relevant interface options, rather than searching for features that have already been moved or renamed.
Does Google Tag Assistant work in Safari?
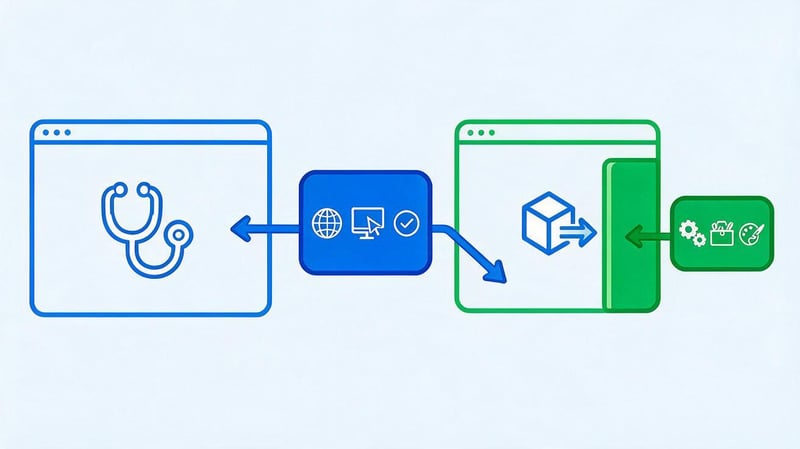
The search for “Google Tag Assistant Safari” is most often requested by users who want to test GTM on a Mac without switching to Chrome. The Tag Assistant web interface can be used separately from the browser extension, so connecting a website via Preview shouldn't be confused with installing a browser-specific add-on.
The official Google Tag Assistant extension is designed for Chrome. Google doesn't provide a separate, up-to-date Safari version of the extension in its documentation. If you only need a standard debug session, you can start with Preview and the web interface. For more complex diagnostics, it's more convenient to use Chrome with the official extension.
Browser selection is especially important when checking iframes, pop-ups, and multiple open pages. Here, an extension provides features that may be missing in a regular session. If the issue only reproduces in Safari, the user scenario itself should still be tested in Safari, even if technical diagnostics are also performed in Chrome.
Is there a Google Tag Assistant extension for Safari?
There's no separate official Google Tag Assistant extension for Safari in the current documentation. The main browser extension is released for Google Chrome. Therefore, installing unverified third-party add-ons simply because of a similar name isn't recommended.
For standard testing, you can open Google Tag Manager, launch Preview, and connect the URL through the Tag Assistant web interface. If the site connects correctly, this is sufficient for most tests of events, triggers, and tags. The extension becomes especially useful for more complex scenarios.
If the task is specifically related to website behavior in Safari, front-end testing can't be completely replaced by Chrome. For example, a form or consent banner may work differently in different browsers. In this case, the technical configuration of GTM is checked using available tools, and the scenario itself is additionally reproduced in Safari.
What features might be different without a Chrome extension?
Google recommends installing a Chrome extension to diagnose Google tags within iframes. It also helps debug pop-up windows and new tabs, open a debug window in a regular browser tab, and work with multiple windows within a single session.
Without these features, basic validation doesn't necessarily stop working. Differences appear when a tag is loaded in a non-standard context or the user's path deviates from the normal page sequence. Therefore, it's important to first determine which specific scenario needs to be checked.
If a regular page opens, events fire, and the correct container is detected, there's no need to switch to another browser just for the sake of it. When the connection drops on an iframe or after opening a new window, Chrome with an up-to-date extension becomes a more suitable diagnostic option.
How to use Google Tag Assistant in GTM?
To test changes, you need a specific scenario. For example, if you're configuring a form submission, it's not enough to simply open the main page and ensure the container has loaded. You need to navigate to the form, fill in the fields, submit it, and find the corresponding event in Tag Assistant.
Next, the check progresses from event to data. First, select the event, then check the status of the desired tag, its trigger conditions, Variables, and Data Layer. If the tag sends data to GA4, the event name and parameters are additionally checked. For ecommerce scenarios, items, value, currency, and other transmitted values are checked separately.
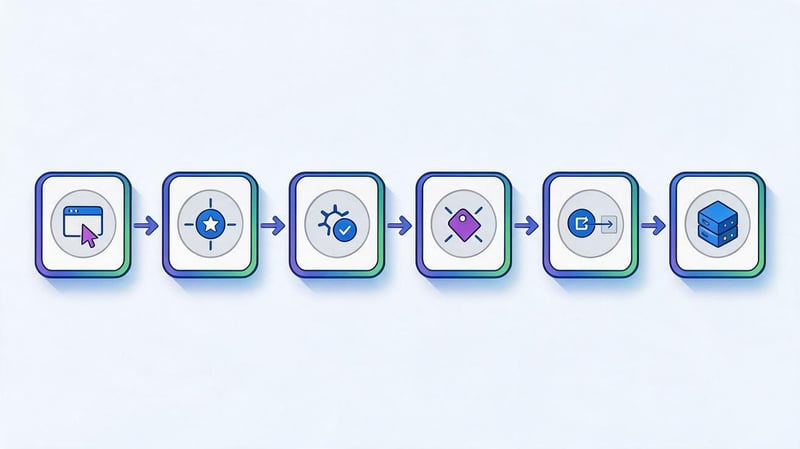
The work chain can be represented as follows:
User action → event → trigger → tag → hit → analytics system.
If the final hit is missing, you need to move back along this chain and find the first stage where the expected data stopped appearing.
How to launch Preview Mode from Google Tag Manager?
Open the GTM container containing the changes you're testing and switch to the workspace. Click Preview. Google Tag Manager will open Tag Assistant in a new tab. Enter the page URL and select Connect.
Once connected, the website being tested will open. Perform the action that should trigger the desired tag: navigate to the page, click a button, submit a form, or complete a test purchase. Then return to the Tag Assistant window and find the corresponding event in the session sequence.
Before analyzing, check the Container ID. Multiple Google tags or containers can be active on a site simultaneously, and the information in the interface is filtered by the selected ID. If you look at a different container, the desired hit may be missing, even though the event itself occurred on the page.
How to connect a website to Tag Assistant?
The connection URL must begin with https:// or http://. After entering the address, Tag Assistant opens the page in diagnostic mode and adds a debug signal. Google's current documentation specifies the _dbg parameter for this session, which helps pass the debug signal to related tools, including GA4 DebugView.
The connection is considered successful when the page being tested opens and Tag Assistant begins receiving event and tag information. After this, you can navigate between pages on the same domain and execute the desired scenario. Events will be added to the current debug session.
If the added parameter changes the site's behavior, you can disable “Include debug signal in the URL” in the connection settings and try again. This option is useful for projects where GET parameters are processed by routing, security, redirects, or custom application logic.
How to read the Tag Assistant interface?
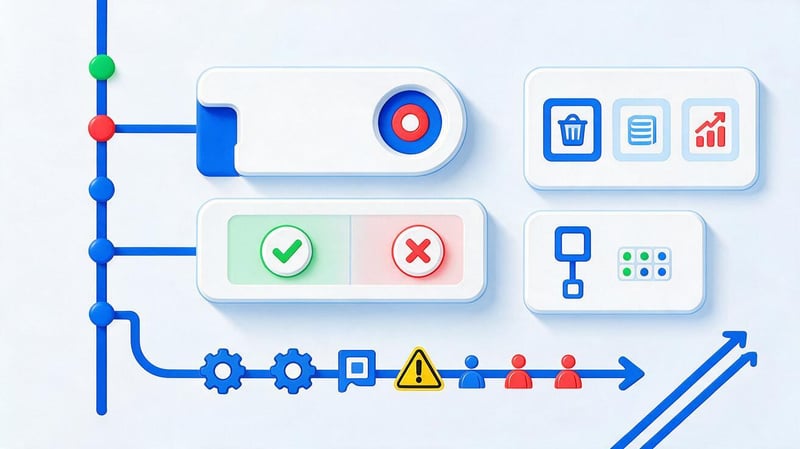
Once connected, there's no need to open every tab. First, identify the desired user action and find the corresponding moment in the event timeline. Then, select the correct Google tag or GTM container ID and drill down to the details of the selected event.
It's easier to compare the expected scenario with the actual one. If you're expecting a generate_lead event after submitting a form, first make sure the event even occurred. Then check the tag, its parameters, and the passed hit. This approach is faster than randomly browsing through dozens of system events.
In the current interface, events are grouped by page, and Output displays hits for the selected ID. If multiple tags or containers are detected, you can switch between them.
Summary
Summary provides a general overview of the current debug session. This is a convenient place to start testing after performing a user action, especially if multiple tags are active on the page. The summary helps you understand which events and data submissions occurred during the selected part of the session.
Don't jump to conclusions based solely on the presence of a tag name. For conversion, it's more important to link it to the correct action and verify the parameters. If the same hit appears twice after a single click, that's a reason to look for a duplicate tag, a second trigger, or a resending event.
When navigating between pages, the session stores history, allowing you to analyze the user's journey sequentially. This is convenient for shopping carts, multi-step forms, authorization, and other scenarios where the target event depends on several previous actions.
List of events
On the left, you'll see the sequence of events Tag Assistant received during the session. GTM often includes the Page View, DOM Ready, and Window Loaded system stages, followed by clicks, custom events, and other site-specific events.
An event should be selected based on the intended action, not just its position in the list. If the user clicked a button but the expected event is missing, the problem may exist even before the tag is configured: the handler didn't send the event, the Data Layer didn't receive the data, or the trigger is listening for a different action type.
On dynamic websites, the event list is especially useful for SPAs. A transition within the interface may not trigger a regular page reload, so it's important to consider which event actually occurs when the screen changes and what trigger is configured for it.
Tags Fired and Tags Not Fired
Tags Fired displays tags that met the trigger conditions for the selected event. If the desired GA4 Event Tag is in this group, the next step is to check its parameters and the actual data sending. Merely being in Fired doesn't guarantee that everything is configured correctly.
Tags Not Fired contains tags that were accessible to the container but failed to meet the current trigger conditions. This is a useful block when an expected tag fails to fire. You can open its details and compare the actual variable values with the conditions specified in the trigger.
Not every tag listed as “Not Fired” indicates an error. A purchase tag shouldn't fire on Page View, and a form submit tag shouldn't fire with a normal menu click. The state should be evaluated only relative to the expected logic of a specific event.
Variables
Variables displays variable values at the selected session stage. This is a convenient place to check Page URLs, Click Text, Click Classes, element IDs, user variables, and values retrieved from the Data Layer.
If the trigger condition appears correct, but the tag remains in Tags Not Fired, compare the expected value with the actual value. For example, the trigger expects /thank-you/, but the variable contains the full URL with parameters or a different trailing slash. For GTM, this difference can be critical.
Variables also help detect errors after website changes. A developer might rename a button's CSS class or modify the DOM, causing the old Click Trigger to no longer execute. Preview immediately shows this during a test click.
Data Layer
The Data Layer stores the data that the page passes to Google Tag Manager via dataLayer.push() and related mechanisms. When setting up events, the event name, IDs, e-commerce parameters, form values, and other data that tags should use are checked here.
For a purchase, simply seeing the event name isn't enough. You need to check the item structure, value amount, currency, transaction ID, and other parameters specified by the specific setting. An empty or invalid value can be reported in analytics even if the tag has formally fired.
When troubleshooting, compare the Data Layer with Variables. If data is present in the layer, but the GTM variable returns undefined, the issue is often related to an incorrect key name, object nesting, or the timing of the value being read.
Output and sent hits
Output helps you see the hits that Tag Assistant has associated with the selected Google tag or container. This is the next step after checking “Tags Fired”: the tag may have fired, but you need to understand what exactly it sent and what ID it refers to.
When using multiple Google products on your site, choose the right ID carefully. For example, a single container can send data to multiple destinations. The Tag Assistant interface filters hits for the selected tag or container, so changing the ID changes the information displayed.
For practical testing, it's convenient to compare three levels: the event occurred, the tag was triggered, and the hit contains the expected parameters. If all three stages match the configuration, the probability of error is significantly lower than when checking only the tag trigger message.
How to check a tag in Google Tag Assistant?

Testing begins with a predefined outcome. Before launching Preview, you need to know which tag should fire, after which event, and what parameters it should receive. Then, in Tag Assistant, you can compare specific expectations with actual data, rather than simply browsing a long list of events.
For example, a form expects a generate_lead event, a single execution of the corresponding GA4 tag, and the transfer of a parameter with the form type. After submission, the presence of the event, the tag status, and its values are checked. If the tag appears twice, the configuration requires correction, even if both hits are successful.
For repetitive tasks, it is convenient to stick to one order:
| Stage | What are we checking? | Sign of correct operation |
|---|---|---|
| Event | The required event appeared after the action | The name and moment of appearance correspond to the scenario |
| Trigger | Launch conditions met | Expected values of Variables are used |
| Tag | The tag is in Tags Fired | One correct launch at the right moment |
| Data | Data Layer contains parameters | The names and values match the setting |
| Sending | Hit appeared in Output | The required ID, event and parameters have been passed |
| GA4 | The event is visible in DebugView | The name and parameters come without duplicates |
The table is suitable as a basic checklist for a form, button, call, registration, or e-commerce event. For each project, parameters relevant to its analytics are added to it.
Checking if a tag is triggered
Select the event on which the tag should fire and open the tag list. If the desired element is listed as “Tags Fired”, check its settings and parameters. If it remains listed as “Tags Not Fired”, open the Triggering conditions and compare them with the Variables values for this event.
Next, open the Data Layer and verify that the page returned the expected data. When the value source is in the Data Layer, this step quickly separates a site error from a GTM configuration error. If the key is already missing in the Data Layer, changing the container variable won't fix the issue.
After this, check the sending to Output or the associated analytics system. This procedure distinguishes four different situations: the event was not created, the trigger was not executed, the tag did not send a hit, or the receiving system did not process the data as expected.
Lead SEO specialist — Gennady
I don't publish changes to GTM immediately after setting up a tag. First, I run the desired user scenario in Preview Mode: I check the event, trigger conditions, Tags Fired, Variable values, and the data in the Data Layer. If it's a GA4 conversion, I also check it in DebugView. This process helps me find errors before incorrect data makes it into production reports.
How to check clicks, forms and conversions?
For a click, first click the desired element on the page being tested, then find the corresponding event in Tag Assistant. Check the Click Text, Click Classes, Click URL, or other variables the trigger relies on. Then, ensure that the target tag fired only on the desired element.
It's important to check for a real successful submission of a form, not just any click on the Submit button. The site may return a validation error, and a very simple click trigger will already send a conversion. A more reliable scenario is to bind the event to a confirmed form submission or an application event.
For purchases, the sequence includes another level of verification. After a test order, find the purchase, check the transaction ID, price, currency, and products. Then, ensure that each order generates one hit. Resending the order when refreshing the page can significantly inflate revenue and the number of transactions.
How can I further check an event in GA4 DebugView?
GA4 DebugView is used after verifying an event in GTM. If Tag Assistant shows the tag firing correctly and the required parameters, open DebugView in the corresponding Google Analytics 4 property and find the same event in the debug data stream.
This way, you can confirm that the data reached GA4 and didn't stop after the tag execution. Check the event name and important parameters. If everything looks correct in GTM, but DebugView isn't receiving anything, it's worth checking the Measurement ID, consent, network requests, and the selected GA4 property.
There's no need to replace DebugView with just checking the Realtime report. Debug mode is more convenient for test setups and allows you to understand the sequence of events. After successful testing, the container can be published, and production data can then be monitored using regular reports.
Why isn't Google Tag Assistant connecting to my website?
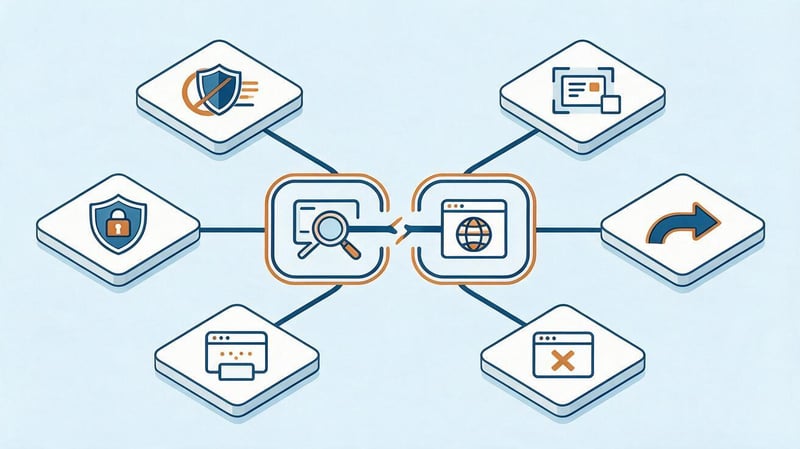
Connection issues aren't always caused by a GTM error. Tag Assistant should open the page, detect the Google tag, and maintain a connection to the test session. This can be hindered by redirects, ad blockers, browser limitations, iframes, consent settings, or site routing issues.
It's best to start troubleshooting with the simplest steps: open the page being tested without Preview and ensure it's accessible without authorization, errors, or endless redirects. Then, check the source code or Network and confirm that the correct container is loading. After that, it's time to move on to the browser settings.
Google specifically lists missing tags, late script loading, AMP, iframes, multiple redirects, ad blockers, extension permissions, and consent management as reasons for connection failure.
Tag Assistant says Google Tag Manager not found
First, check the Container ID. The staging and production domains may use different containers, or the developer may have left the old ID in the template. You can find GTM through the source HTML or Network by filtering requests by gtm.js and the container ID.
If the code is present, check when it loads. Some sites launch GTM only after user consent or after additional JavaScript is executed. Tag Assistant may attempt to connect before the tag is available. In this situation, Google suggests retrying the connection via Retry.
An iframe is a special case. When a Google tag loads within an iframe, Google recommends the Tag Assistant Chrome extension for a complete diagnosis. If the main document is detected without the extension, but the required tag is missing within the embedded content, this may be the cause.
The site opens, but Debug doesn't connect
First, temporarily disable your ad blocker for the domain you're testing. Ad blockers can stop Google tags from loading or network requests, preventing Tag Assistant from receiving data. If you're using a Chrome extension, check that it allows you to read and modify data on the current website.
Next, check your redirects. A chain of multiple redirects can sometimes prevent the debug session from being maintained between the source URL and the destination page. Content Security Policy can also cause an issue if CSP rules prevent the loading of required Google resources or connections to them.
The Consent Management Platform is tested separately. If the CMP completely blocks Google tags before consent, the behavior must comply with the selected Consent Mode model. When diagnosing, it's important to understand whether a specific tag is expected to fire before consent or only after the consent state changes.
What to do if the debug parameter breaks the page?
When connecting, Tag Assistant may add the _dbg parameter to the URL. Most sites handle it normally, but on projects with strict routing, non-standard redirect rules, or custom query string processing, the parameter sometimes changes page behavior.
In this case, change the settings of the connecting domain and disable “Include debug signal in the URL”. Then reopen the page and test the connection. Google specifically lists this option among the methods for fixing debug session issues.
After a successful connection, be sure to replay the original scenario. Old events from the previous attempt should not be used for the final check, as the launch conditions may have been different. A clean session makes the results clearer and reduces the risk of confusing two different tests.
Why is the tag in Tags Not Fired?
The first option is that the selected event simply shouldn't trigger this tag. For example, a form tag expects a custom event called form_success, but a specialist is looking at its state on a regular Click event. You need to select an event for which the corresponding trigger is configured.
If the event is valid, open Variables and compare the actual values with the trigger conditions. This could be due to a different Page Path, a changed CSS class, an empty Data Layer Variable, capitalization issues, or a mismatched custom event name. These errors are especially common after front-end changes.
Also check your exclusion conditions and consent. A tag may match the primary trigger but be blocked by an exclusion, consent settings, or a sequence of other tags. Fixing the issue should only be done after identifying the specific unmet condition, rather than replacing a complex trigger with All Pages.
How to work with multiple tabs and containers?

Complex user scenarios are rarely limited to a single page. A form might open in a new window, a payment might redirect to a separate domain, and an app might use multiple Google tags simultaneously. In such cases, it's especially important to understand which page, tab, and Container ID the selected event refers to.
Tag Assistant saves the current session history and groups events by page. This helps you return to a previous step and see what data was transferred before a transition. However, each hit must be analyzed within the context of the selected container; otherwise, data from a neighboring configuration may be mistaken for the desired tag's output.
The Chrome extension adds additional capabilities for multiple windows and new tabs. Google lists this support as one of the reasons to install the extension for complex diagnostics.
Debugging multiple pages and tabs
When navigating within a single scenario, don't close the debug session after each page. Follow the user's entire journey from start to finish, and then analyze the sequence of events. This will make it easier to see where exactly a parameter was missing, consent state changed, or an extra hit occurred.
For a new window or pop-up, ensure that Tag Assistant continues to receive events after it opens. If a regular web session is losing some data, use the latest Chrome extension. It's designed to diagnose new windows and multiple browser windows in a single session, among other things.
Once the test is complete, repeat it from scratch after correcting the configuration. Avoid comparing the new event with data left over from another container version in the old session. This approach is especially important when detecting duplicates and sequencing errors.
How to switch between GTM containers?
If multiple Google tags or containers are detected on a page, Tag Assistant prompts you to select the desired ID. Once selected, the Output and associated data are displayed for that specific ID. Therefore, before analyzing, always check it against the container in which the changes were made.
Multiple containers may be encountered after migrations, when working with individual teams, or on sites with legacy analytics. This isn't always a bug, but identical events may be sent from different locations. If you suspect duplicates, you should check each detected container and determine the source of the duplicates.
Check separately to see if both a GTM configuration and a direct gtag.js implementation are sending the same conversion. In this case, Tag Assistant can help you identify multiple related sends and understand which implementation should remain after clearing the configuration.
How do I transfer a Debug session to another specialist?

Not every error can be easily described with screenshots. If a developer or analyst needs to see the exact sequence of events, Tag Assistant allows them to delegate access to diagnostics or export session history. This is especially useful when the issue can only be reproduced with a specific set of actions.
When transferring data, privacy must be considered. Values sent by the site through tags and the Data Layer may be included in the debug history. Google warns that if PII is present, such data will also be included in the exported session file.
Before exporting, it's best to test with technical or test data. Actual phone numbers, email addresses, names, and other personal information should not be transmitted to analytics or used for demo debug sessions.
How to share a debug link?
Launch a debug session and perform the actions that reproduce the issue. Then, open the additional actions menu in Tag Assistant, select Share, and check the access settings. You can then copy the link and share it with the specialist who will analyze the configuration.
A link is convenient when a second person needs to continue testing the site independently. Before handing it over, clarify the test URL, the expected event, and the step where the error occurs. Without this, even detailed diagnostic information may require re-creating the entire scenario.
After completing the work, it's best to use access only for the specific task. If the issue is related to a closed staging site or user account, check in advance whether a second specialist can access the required page from their end.
How to export and import a Debug session?
To export, open the Tag Assistant menu and select “Export session”. The resulting file contains the history of the completed check. You can share it with a specialist, who will import the session using “Import session” and view the recorded events in view-only mode.
An imported session is read-only. It doesn't allow further site navigation or new hits. If you need to reproduce the actions yourself, it's best to grant debug access and use the export to analyze the completed scenario.
The file should not be manually edited. Google warns that changing its name or contents may corrupt the data. Before submitting, also ensure that no sensitive information was transmitted via tags during the test.
GTM Pre-Publishing Checklist

Before publishing a new version of a container, it's helpful to run through the same set of checks. A checklist reduces the likelihood of missing a duplicate, an erroneous variable, or a tag that only fires in one of several scenarios. For critical conversions, it's best to check both the desktop and mobile versions of the site.
First, go through the main scenario, then the boundary cases. For a form, this could be a successful submission and a validation error; for a purchase, it could be a single completed order without a repeat purchase after refreshing the page. If the tag depends on consent, check the states before and after the user's selection separately.
The following conditions must be met before publication:
- Tag Assistant connects to the correct domain, and the correct GTM container ID is selected in the session.
- Basic page load events occur in the expected sequence with no obvious errors.
- The target action creates the required event, and its name corresponds to the analytics settings.
- The required tag is found in Tags Fired only on those events where it should actually be fired.
- Tags Not Fired are checked for the target event if the expected tag is among them.
- Variables contain values that match the conditions of configured triggers.
- The Data Layer passes the required parameters and does not contain invalid or empty required values.
- One user scenario does not create unnecessary repeated executions of the same tag.
- Output shows the expected hit and the correct Google tag, Measurement ID, or other destination identifier.
- GA4 conversion events are additionally checked via DebugView if they are used in analytics.
- Consent Mode and associated logic have been tested for the consent states possible on the site.
- After a successful retest, changes can be submitted via Submit and a new version of the container can be published.
After making corrections, the entire scenario should be re-run from the beginning. Testing a single problematic event doesn't always reveal side effects on other tags. This is especially true for changes to shared variables, consent settings, and triggers used by multiple events.
Preview Mode and Google Tag Assistant provide enough data to test most GTM settings before publishing. The workflow is simple: reproduce the user action, find the event, check Triggering, Tags Fired, Variables, Data Layer, and the hit sent, and for GA4, additionally check DebugView.
If Tag Assistant shows an error, it's better to look for a specific break in the chain rather than randomly changing settings. This approach helps isolate the website issue from the GTM error and quickly identify duplicates, incorrect parameters, or failed triggers.
If you need to configure or re-test Google Tag Manager, GA4 events, or conversions on your website, provide Seo-Gen specialists with a list of required user actions and access to the test environment. We'll test your scenarios using Preview and Debug, fix any errors, and prepare the container for publication.
More articles about SEO Promotion


