Google Analytics 4: what is it and how does it work?


Google Analytics 4, or GA4, collects data about website and app visitors, their actions, referral sources, and the results of those visits. Google Analytics lets you see where a user came from, which pages they viewed, how long they spent on the site, and whether they completed the desired action.
Google Website Analytics is essential for business owners, marketers, SEO specialists, and developers who need more than just a visitor counter. The service helps correlate traffic with inquiries, purchases, registrations, file downloads, and other events relevant to a specific project.
To make data useful, creating an account and adding a tag isn't enough. You need to verify data collection, configure the necessary events, define key actions, and understand the purpose of reports. Below, we'll discuss how GA4 works, how to connect Google Analytics to your website, and which data points are worth monitoring first.
What is Google Analytics 4 and what is it for?
Google Analytics 4 is Google's latest analytics system for websites and mobile apps. It records visitor actions as events. Page views, scrolling, external link clicks, site searches, form submissions, and purchases can be transferred to a single property and analyzed together.
Google Analytics for a website helps answer practical questions. An online store owner can see which channels are bringing in customers, an SEO specialist can see which landing pages are receiving organic traffic, and a marketer can see which advertising campaigns are driving leads and sales.
The main tasks covered by the service:
- analysis of website traffic, new and active users, devices and geography;
- identifying traffic sources and channels through which people come to the site;
- tracking events, inquiries, registrations, purchases and other key actions;
- evaluation of entry pages, visitor behavior and user journey quality;
- creating audiences for analysis and further work with advertising systems.
Google Analytics offers more than just standard reports. With proper configuration, data can be transferred to BigQuery, visualized in Looker Studio, linked to Google Ads, and supplemented with Google Search Console reports.
What data does Google Analytics 4 show?

In the GA4 interface, data is grouped around users, events, traffic sources, and site content. One report might show the number of visitors, another the pages from which sessions began, and a third the actions performed after a click.
Google Analytics metrics should be read in context. User growth alone doesn't indicate traffic quality, so traffic is typically compared to engagement, key events, inquiries, or revenue.
Users
Active Google Analytics users are people who interacted with a website or app during the selected period. New Google Analytics users represent those who interacted with the site or app for the first time within the data available to the system.
Reports also allow you to analyze country, city, device type, browser, operating system, and other characteristics. This information helps you spot differences between mobile and desktop traffic or between visitors from different regions.
Sessions and interactions
A session aggregates user actions over a specific period of interaction. A single user can create multiple sessions, so the number of users and the number of sessions typically differ. Google Analytics begins recording a session when an interaction with a website or app begins.
In addition to the total number of sessions, GA4 displays engaged sessions and interaction time. This data is useful for comparing different traffic sources, landing pages, and visitor groups.
Page views
A pageview is transmitted via the page_view event. For a typical website, GA4 typically collects it automatically after correctly connecting the Google tag and configuring the appropriate data stream.
The page_view count shows the number of recorded views, not the number of unique users. A single visitor can open a page multiple times, move to another page, and then return back, so there are usually more views than users.
Events
An event describes a specific user action. In GA4, events can record a page view, scroll, click, file download, site search, form submission, adding an item to a cart, or a completed purchase.
Some events are collected automatically, others are enabled through Enhanced Measurement, and events for specific business actions are configured separately. This model allows for analyzing actions using the same logic across the website, Android, and iOS.
Key events
Key events denote actions that are particularly important for a business. These could include submitting an inquiry, registering, purchasing, booking, or any other event related to the website's purpose.
Previously, the GA4 interface commonly used the term “conversions” for such actions. Google now distinguishes between Analytics key events and Google Ads conversions, so it's best to use the current terminology in the new instructions.
Parameters and metrics
Dimensions describe data properties, while metrics display numerical values. Country, traffic source, device, URL, and page title are dimensions. Users, views, sessions, number of events, and revenue are metrics.
This division is used in many reports. For example, you can select landing page as a dimension and compare active users, engaged sessions, and the number of key events for each page.
Answers to your questions
What is Google Analytics 4?
Google Analytics 4 is Google's latest platform for analyzing websites and mobile apps. It collects user actions as events and links them to traffic sources, pages, devices, and other parameters.
The service is used to analyze traffic, audience behavior, inquiries, purchases, and marketing channels. For web projects, data is collected via Google Tag or Google Tag Manager.
Is Google Analytics 4 free?
The standard version of GA4 is available for free and is suitable for most websites. It includes standard reports, events, key events, audiences, and integrations with a number of other Google products.
For larger companies, Google Analytics 360 offers expanded enterprise capabilities and limits. It's worth evaluating the transition to 360 based on the actual project requirements.
What is Google Analytics for on a website?
Google Analytics helps you understand how many people visit your site, where they come from, and what they do after they land. It lets you analyze content, sources, devices, events, and key actions.
Linking visits to results is especially useful for businesses. If you've configured leads or purchases, you can compare channels based on target actions, not just traffic volume.
How to install Google Analytics 4 on a website?
First, you need to create a GA4 property and a web data stream, then obtain a Measurement ID. Then, you can install the Google tag directly, through the CMS, or through Google Tag Manager.
After installation, open the website and check the data in Realtime, Tag Assistant, and, if necessary, DebugView. Without this check, it's impossible to ensure the counter is working correctly.
What is GA4 Measurement ID?
Measurement ID is the Google Analytics 4 web stream identifier. It typically begins with G- and is used to direct site data to the desired property.
It can be found in the settings of the corresponding web data stream. When working with multiple projects, be especially careful in checking the ID before publishing the tag.
How is Google Analytics 4 different from Universal Analytics?
Universal Analytics used an older architecture and was more focused on sessions and specific types of interactions. GA4 builds data collection around events and parameters.
Instead of the old Goals, modern logic uses events and key events. For new projects, refer to the GA4 documentation, and use the old UA instructions only for historical context.
Where can I see website traffic in GA4?
You can view live activity in Realtime, and the main data is available in standard Reports. Acquisition is used to evaluate sources, and the Pages and screens and Landing page reports are used for content.
Traffic alone is usually insufficient. It's best compared to engagement and key events over the same period.
What is page_view in GA4?
page_view – a page view event. On a typical website, it is most often collected automatically after the Google tag is correctly connected and the data stream is configured accordingly.
For SPAs, virtual transition handling should be checked separately. If multiple page view sending methods are enabled simultaneously, page_view may be duplicated.
Why isn't Google Analytics showing data?
The issue could be related to an incorrect ID, a missing tag, unpublished GTM, a trigger, consent, or a browser blocker. Sometimes, the user is simply viewing a different property or expecting the standard report to appear immediately.
It's best to start diagnostics with Tag Assistant and Realtime. Then you can use DebugView to inspect specific events and parameters.
How to view search queries in Google Analytics?
Basic data on Google search queries is available in Search Console. It shows queries, clicks, impressions, CTR, and average search position.
GA4 helps analyze actions after landing on a website. For SEO, it's best to use these systems together by linking relevant properties.
How does Google Analytics 4 work?

GA4 receives data through a collection mechanism installed on a website or app. For a web project, this is typically a Google Tag or Google Tag Manager. After a user action, the browser sends the information to the appropriate data stream, where it is linked to the Analytics property.
A simplified diagram can be represented as follows:
User → website action → Google tag or GTM → data stream → GA4 property → processing → report.
Some information appears almost immediately in Realtime and DebugView, while standard reports may be updated later. Therefore, installation verification typically begins with realtime tools rather than waiting for data in a standard report.
GA4 Event Model
In GA4, the basic unit of collection is the event. Each action can have its own name and a set of additional parameters. For example, a link click can be supplemented with the link_url value, and a pageview can be supplemented with the page_location address and page_title.
The old Universal Analytics was built around a different data model and used categories, actions, labels, and Goals familiar to many specialists. In GA4, events and their parameters are used much more broadly.
| Universal Analytics | Google Analytics 4 |
|---|---|
| The main emphasis was on sessions | The main structure is built around events |
| Different approaches were used for websites and applications | Web and app work in a common event model |
| Goals were used for important actions | Events and key events are used |
| Property identifiers began with UA | GA4 web streams use Measurement ID format G-... |
The queries “ua analytics”, “ua google analytics”, “google analytics universal”, and “google analytics ua id” refer to the older version of the platform. For a new project, you need to create a GA4 property and use the current data model.
What events does GA4 collect automatically?
After the basic installation of Google Analytics 4, some technical events are sent without any additional configuration. Additional actions can be enabled via Enhanced Measurement in the web data stream settings.
For a typical site, the following events are of interest:
- page_view records a page view and is used in content reports;
- scroll indicates when the user reaches a certain page depth;
- click can record transitions to external domains;
- file_download is used to download supported file types;
- view_search_results is related to the use of the site's internal search.
The composition of the automatic data depends on the environment and property configuration. After connecting, it's best to open DebugView or Tag Assistant and check the actual events, rather than assuming the setup is complete just because the tag is present in the code.
How does GA4 link user actions?
To analyze the sequence of actions, GA4 uses available browser and application identifiers. If a project transmits a User-ID for authorized visitors, the system can use it along with other signals as part of the configured identification.
It's impossible to guarantee that every visit will be linked to a single user's profile. Users may change devices, clear cookies, opt out of analytics, or open the website in a different browser.
Therefore, Google Analytics data should be viewed as an analytical model of audience behavior. When comparing periods and channels, it's especially important to maintain the same consent settings, events, and tags.
How to create Google Analytics 4?

To get started, you need a standard Google account, which allows the user to access Analytics. Then, within the service, you create an Analytics account, a GA4 property, and a data stream for your website or app.
The structure looks like this: an account contains one or more properties, and within each property are web or app streams. This scheme is convenient for a company with multiple websites, applications, or separate projects.
Creating a Google Analytics account
After logging in to the service, the user creates an Analytics account and specifies its name. A Google account and an Analytics account are separate entities: the former is used for authorization, while the latter stores the property structure and access settings.
When an agency works with a client project, it's best to create an account so that the client retains ownership of the data. Sharing login and password information with the contractor is unnecessary, as access can be granted to a specific user.
Creating a GA4 property
The next step is to create a Google Analytics 4 property. In the settings, specify the name, time zone, and currency, and then add the business information needed for initial configuration.
It's best to select the correct time zone from the start, especially for projects with advertising and daily reports. Incorrect settings make it difficult to compare Analytics with CRM, advertising accounts, and internal statistics.
Creating a data stream
The data stream determines the source from which GA4 will retrieve information. Web is selected for the website, while Android and iOS are available for mobile apps.
The web stream specifies the URL and site name, after which connection parameters are received. Enhanced Measurement, Google tag, and Measurement ID settings are also located here.
If a company has both a website and an app, the streams can be hosted within a single property. This helps analyze data within a common model with a proper measurement architecture.
What is Measurement ID?
Measurement ID is the web data stream identifier in GA4. It typically looks like G-XXXXXXXXXX and indicates which stream the website data should be sent to.
Queries like id ga4, id google analytics 4, and google analytics ua number often arise due to old instructions. The new GA4 web stream requires an identifier in the G-... format, not the old UA-ID.
Measurement ID is used when installing Google tags directly, in some CMSs, and when configuring tags through GTM. Before publishing, it's a good idea to check that the code specifies the ID of the desired property, and not a test or third-party project.
How to install Google Analytics 4 on a website?

The installation method depends on the website platform and future goals. For a simple project, you can connect a Google tag directly. If you need to manage multiple marketing tags and regularly add events, Google Tag Manager is more convenient.
After installation, you can't just check the source code. You need to open the site, run a test session, and ensure that events are actually being sent to the correct GA4 property.
Installation via Google tag
With direct connection, a Google tag based on gtag.js is used. The code is taken from the specific property's settings and placed in the <head> of the site's pages according to Google's instructions.
There's no need to manually build a “script ga” snippet or copy the code from an old article. The tag must have the Measurement ID of your web stream, otherwise the data will go to another property or won't be collected correctly.
Direct installation is suitable for sites with simple analytics. If you later need multiple events, ad pixels, and trigger conditions, it's worth comparing this approach to GTM.
How to install GA4 via Google Tag Manager?
The gtm ga4 bundle is suitable for projects where tags are managed through a Google Tag Manager container. First, the GTM container itself is installed on the site, then a Google tag is created within it and the required Tag ID is specified.
The basic sequence looks like this:
- Create or open a GTM container that is installed on the desired domain.
- Add a Google tag and specify the ID of the corresponding GA4 stream.
- Configure the tag to launch on the required website pages.
- Run Preview and check that data is sent via Tag Assistant.
- After successful verification, publish a new version of the container.
The queries “google analytics in gtm”, “google tag manager google analytics 4”, “add google analytics tag manager”, “g4 tag”, and “tag ga4” refer to this setup. Older guides may refer to “GA4 Configuration Tag”, but in the current setup, the base tag is called “Google tag”.
Should I choose gtag.js or Google Tag Manager?
Both methods can correctly transfer data to GA4. The choice depends on the project architecture, the number of tags, and who will support analytics after launch.
| Criterion | gtag.js | Google Tag Manager |
|---|---|---|
| Basic GA4 installation | Fits | Fits |
| Setting up multiple marketing tags | Requires code changes | Controlled from a container |
| Checking launch conditions | Depends on implementation | There is Preview and Tag Assistant |
| Working with the Data Layer | Possible through development | Conveniently used via GTM variables |
| Frequent changes in events | Usually a developer is needed | Many changes can be made through GTM |
For a small site with a minimum number of measurements, a direct tag is sufficient. For projects with advertising, forms, e-commerce, and regular changes, GTM usually simplifies future maintenance.
How to install Google Analytics on WordPress and other CMS?
There are several possible connection methods for CMS. Some platforms allow you to specify the Measurement ID in the default settings, others use an integration module, and for more complex projects, GTM is used.
In WordPress, it's not a good idea to simultaneously connect the same property via a plugin, template code, and Google Tag Manager. This duplication often leads to duplicate page_views and inflated statistics.
On Prom.ua, Shopify, and other platforms, you need to consider the capabilities of the specific CMS. If the built-in integration already transmits e-commerce events, an additional custom tag may duplicate purchases and other actions.
After any installation method, the verification procedure is the same: open the website, perform test actions, check Realtime, Tag Assistant, and, if necessary, DebugView.
How to check if Google Analytics is working?

Verification is required immediately after installation and after each major tag change. The presence of a script in the source code does not necessarily confirm that the data is being sent to the correct property without errors.
For basic diagnostics, use Realtime, Tag Assistant, and DebugView. These tools perform different tasks, so if you encounter any issues, it's best to check them sequentially.
Realtime Report
Realtime shows recent user activity and is suitable for initial site checks. Open the page in a separate browser, navigate to several URLs, and see if the active user and relevant events appear.
If your own visit doesn't show up immediately, it doesn't mean GA4 is completely broken. Consent, ad blockers, internal traffic filters, and browser settings can all affect the results.
Realtime is also convenient to use after launching a new event. For a detailed technical check of the parameters, it's best to switch to DebugView or Tag Assistant.
Tag Assistant
Tag Assistant helps you check Google tags on a specific page and see which ones fired during a test session. When using GTM, it works closely with Preview mode.
This tool is useful when Google Analytics isn't showing data or when multiple containers are installed on a page. You can check the Tag ID, tag firing order, and page transitions.
If the tag didn't fire, you need to check the launch conditions and consent status. If it fires twice, you should look for duplicate installations via the CMS, website code, or a second container.
DebugView
DebugView displays a stream of debug events and their parameters. It's convenient for checking event names, page_location, link_url, e-commerce parameters, and other data before publishing the setting.
For example, after clicking a button, you can verify that the expected event was sent and the required parameters have the correct values. This test reduces the risk of a situation where an event technically exists but contains useless or empty data.
After checking, you should exit debug mode and make sure that regular visitors also transmit data in accordance with the project settings.
Why doesn't Google Analytics show visits?
There could be several reasons, so don't immediately reinstall your Google Analytics counter. First, determine at what point the data stops being transmitted.
Most often, the problem is related to one of the following situations:
- Google tag is missing on some pages or is installed in the wrong website template;
- the tag specifies the Measurement ID of another property or test data stream;
- changes in GTM have been saved, but the new version of the container has not been published;
- the trigger is not executed on the desired page or is blocked by consent settings;
- the user checks data in another property, account or stream;
- the browser, an extension, or a privacy policy blocks analytics from being sent.
If Realtime is working but the standard report is still empty, consider the data processing time. To check your Google Analytics setup, it's best to use Realtime tools first and then return to standard reports.
How to use Google Analytics 4?

The GA4 interface is easier to master through specific tasks. First, determine what you need to know: traffic source, popular pages, user actions, inquiries, sales, or advertising campaign performance.
Using Google Analytics becomes clearer after a few hands-on tests. For example, you can first open the Acquisition report, then Pages and Screens, and then view key events for the desired source or page.
Home page
The main page displays summary cards and recent data for the property. It's convenient for quickly viewing trends, but it doesn't replace a full Google Analytics report.
Cards may change depending on usage history and property settings. Therefore, for regular analysis, it's best to switch to specific reports and use the same parameters when comparing periods.
For beginners, simply treat Home as a navigation point. Key operational data is located in the Reports, Explorations, Advertising, and Admin sections.
Reports
The Reports section contains standard reports on traffic, users, content, and events. The collections may vary depending on the property settings and published reports.
Website analysis most often involves acquisition sources, landing pages, pages and screens, events, demographics, and technologies. It's best to start a Google Analytics review with these sections.
Don't open dozens of reports at once. Choose one question, set a time period, and compare several related metrics to give your numbers context.
Explorations
Explorations are designed for more flexible data analysis. Here you can create custom tables, segments, funnels, user journeys, and other analyses not included in standard reporting.
This section is useful when you need to compare audience groups or view the pre-purchase sequence. For example, you can examine the path from the category page to the product page and checkout.
For your first introduction to GA4, mastering the standard reports is sufficient. It makes sense to use explorations once the basic events are already configured and data is collected consistently.
Advertising
The Advertising section analyzes data related to advertising paths and attribution. This section's practical value increases after connecting Google Ads and correctly setting up key events.
When comparing GA4 and your advertising account, figures may differ due to attribution models, processing times, and other accounting rules. Therefore, you shouldn't automatically expect perfect alignment.
This section helps understand the contribution of different channels to the user journey. To evaluate ROAS, GA4 also requires accurate revenue and purchase data.
Admin
Admin contains account and property settings, data streams, access, connections to other Google products, and a significant portion of the technical configuration.
This is where you work with users, integrations, events, key events, and other property parameters. It's a good idea to understand the implications before changing settings, especially on a production project with large amounts of data.
When transferring a project to another specialist, it's best to grant access through Admin. Sharing the shared account password is not required for this task.
Which GA4 reports should I look at first?
A beginner doesn't need to learn the entire interface at once. A few reports already provide sufficient information about traffic, pages, and audience actions.
The useful set depends on the type of website. For a blog, landing pages and organic traffic are important; for lead generation, sources and inquiries; for e-commerce, the path from product viewing to purchase.
| Task | What to check |
|---|---|
| Understand where users come from | Acquisition and traffic sources |
| Find popular content | Pages and screens |
| Evaluate landing pages | Landing page |
| Check actions | Events and key events |
| Compare audiences | User attributes and segments |
| Find problems in purchasing | Funnel exploration and e-commerce events |
The table is suitable as a basic interface map. To draw conclusions, data should be compared across similar time periods and taking into account changes on the website.
Traffic sources
Google Analytics displays traffic sources using the source, medium, campaign, and channel grouping parameters. This allows you to differentiate between organic search, direct, referral, paid search, social, and other traffic types.
Source and channel denote different classification levels. For example, a specific source might be google, while the channel might be Organic Search or Paid Search, depending on the medium and grouping rules.
What is “Direct Google Analytics”? This is a common question, as this channel is sometimes considered to be entirely direct visits. It can also include visits for which Analytics couldn't identify another source.
Pages and screens
The Pages and Screens report helps you understand what content users view most often. Here you can compare views, active users, engagement time, and related events.
For SEO, it's helpful to analyze pages along with their traffic source and landing page. A standard pageview list doesn't show which page an organic session originated from.
Google Analytics website statistics become more useful when contextualized. A high-traffic page may generate few leads, while a less-visited commercial page may generate the majority of inquiries.
Active and new users
Active users represent the audience that interacted with the property during the selected period. New users help understand the volume of first-time interactions with a website or app.
The ratio of these groups depends on the type of project. A news site, a subscription service, and an online store may have completely different repeat visit patterns.
Therefore, there is no universal “good” share of new users. This metric is more useful when compared across periods, channels, and advertising campaigns within a single project.
Sessions and Engagement

GA4 displays the number of sessions, engaged sessions, and related interaction metrics. These help evaluate the quality of visits without focusing solely on single page views.
The default inactivity timeout is usually 30 minutes, although this setting can be customized. For this reason, a single user can create multiple sessions throughout the day.
It's best to analyze website visits in Analytics along with the source, landing page, and key events. This way, you can attribute the increase in sessions to a specific channel and the actual result.
Events and Key Events
The Events report shows what actions are recorded on the property and how many times they occurred. It includes automatically collected, recommended, and custom events.
Key events highlight actions that the team considers significant for the business. For a service company, this might be submitting a form, while for a store, it is purchase.
Before analysis, you should check the quality of the settings. If the same event is sent twice, the report will overestimate the results, no matter how carefully the filters are constructed.
Audiences
Google Analytics audiences are created based on criteria. A single group can include new visitors, users from a specific country, or people who viewed a product but didn't complete a purchase.
Audiences are useful for both analysis and related advertising scenarios. However, the conditions should match an actual business question rather than be created just to have more segments.
For a small project, it's best to start with a few clear groups. A complex audience system without a clear purpose quickly becomes difficult to maintain.
User journeys and funnels
Explorations help you see the sequence of actions between pages and events. For an online store, a typical path looks like this:
Category → product card → add_to_cart → begin_checkout → purchase.
If a significant drop is noticeable at one stage, it's necessary to check the interface itself, technical errors, and the correctness of events. Analytics show where behavior is changing, but the cause requires separate analysis.
In older materials, Google Analytics behavior maps were often described using Universal Analytics reports. In GA4, Path exploration and Funnel exploration are more convenient for such tasks.
Events in Google Analytics 4

Events form the basis of most GA4 measurements. Even a pageview is recorded as an event, and additional parameters help describe the context of that action.
A good event schema starts with a business task. First, determine which actions need to be measured, then select a standard event or create your own, and only then pass the parameters.
Automatically collected events
GA4 logs some events after the basic installation without any additional configuration. These events vary depending on the platform and terms of service.
Such events are necessary for basic analytics, but they don't cover all business needs. Submitting an inquiry, performing a specific calculation in a calculator, or successfully completing a custom form may require separate configuration.
Before creating your own event, check Google's documentation. There may already be a recommended name for the action you need.
Enhanced Measurement
Enhanced Measurement adds the ability to collect a range of interactions on a web stream without manually developing each event. These can include page views, scrolling, outbound clicks, site searches, and file downloads.
The file_download event is useful for websites with catalogs, presentations, price lists, and documents. It helps gauge interest in files if the format and link meet the automatic measurement criteria.
The function should be tested after activation. On a non-standard website, the automatic logic may not cover the desired action or require additional configuration.
Recommended events
Google publishes recommended event names for typical scenarios. For online stores, these include view_item, add_to_cart, begin_checkout, purchase, and other actions.
Using standard names simplifies working with reports and related Analytics functions. However, simply passing the event name isn't enough: for e-commerce, the correct products, price, currency, and other required parameters are required.
It's best to use custom names for actions that don't have a suitable recommended event. This makes the analytics framework clearer for the next specialist.
Custom events
A custom event is created when the standard model doesn't describe the required action. For example, a service might measure the successful completion of a complex calculator or the completion of a specific step in a survey.
The name should be chosen once and used consistently. Don't create send_form, form_sent, lead_form_success, and several other variations for the same action without a reason.
Before implementation, it's helpful to create a table of events, their conditions, and parameters. Such documentation reduces the number of errors encountered by the developer, marketer, and SEO specialist.
What are event parameters?
Parameters add context to an event. For a click, this might be link_url, for a pageview, page_location, and for a product, its ID, name, and category.
Google Analytics custom dimensions are useful when the event name alone isn't sufficient for analysis. After passing the required values, some dimensions may require additional registration in the interface for use in reports.
The number of parameters shouldn't become an end in itself. Provide data that will actually be used in analysis and decision-making.
How to set up key events in GA4?
First, the property must receive the required event. After verification, it can be marked as a key event if the action is truly related to an important outcome: an inquiry, registration, booking, or purchase.
For a service website, such an event might be the successful submission of a form, not a simple click on the “Submit” button. For a store, the key action is usually a confirmed purchase, not opening a shopping cart.
Old queries like “Google Analytics goal”, “Creating goals in Google Analytics”, “Create a Google Analytics goal”, and “How to add a goal in Google Analytics” refer to the old terminology. Universal Analytics used Goals, while in GA4, tasks of this type are built around events and key events.
It's advisable to test key events before using them in reports or advertising. Errors at this level impact the evaluation of channels, funnels, and advertising conversions.
Google Analytics 4 for SEO
GA4 helps analyze the behavior of audiences who have already reached your site from Google and other sources. For SEO, linking landing pages, organic search, interactions, and key events is especially useful.
Google Search Console should be used separately, as search queries, impressions, clicks, and positions are all search data. GA4 addresses the other part of the problem – it shows what happened after the user landed on the site.
What can an SEO specialist analyze in GA4?
Google Analytics 4 SEO is used to evaluate organic traffic, landing pages, devices, regions, and visitor actions. You can compare pages across time periods and see which URLs attract users from Organic Search.
A useful Google Analytics website analysis typically includes several related metrics: landing page, active users, engaged sessions, and key events. For commercial pages, it's also helpful to look at inquiries or transactions.
Lead SEO specialist — Gennady
I don't evaluate a website solely by the number of users or sessions in GA4. For SEO, I link the traffic source, landing page, engagement, and key action. If organic traffic is growing but users aren't completing an inquiry or purchase, I first check the events and page quality before assessing the promotion's results.
Where can I see search queries?
A complete list of search queries cannot be obtained from standard GA4 reports. Search Console remains the primary source of Google query data, where clicks, impressions, average position, and CTR are available.
Therefore, it's best to consider the query “how to view keywords in Google Analytics” in conjunction with the Search Console integration. Once the services are linked, some of the data can be used alongside website analytics.
GA4 alone isn't enough for semantic analysis. Search Console shows the query before the click, and Analytics helps evaluate post-click behavior.
How to link GA4 to Google Search Console?
The connection is configured in the Analytics admin panel if you have the necessary rights to both properties. You need to select the corresponding Search Console property and GA4 web stream.
Once configured in Analytics, you can use published Search Console reports. These help correlate organic traffic with landing pages and subsequent user behavior.
Before integrating, make sure you've selected the correct properties and domain. This error is especially likely for companies with multiple language versions or subdomains.
Which pages should be analyzed for SEO?
First, they look at pages that receive organic incoming traffic. Then, they compare their dynamics, engagement, and key events with the previous period.
For services, it's useful to separately analyze commercial landing pages; for a blog, analyze informational articles that participate in internal linking or bring in new users.
A page with a drop in organic traffic requires additional review of Search Console, indexing, and SERPs. GA4 shows changes in behavior and traffic, but doesn't explain every reason for the ranking drop.
Google Analytics 4 for online stores
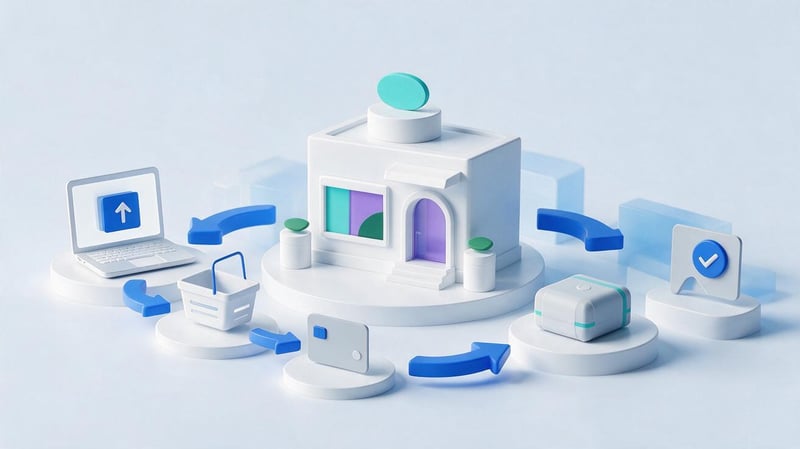
For e-commerce, traffic alone isn't enough. Analytics must show the sequence of actions from product viewing to completed transaction and provide data on the order contents.
The standard schema uses the view_item, add_to_cart, begin_checkout, and purchase events. These help us understand at what stage customers most often abandon checkout and which products are being sold.
For purchases, you must correctly transmit the transaction ID, currency, price, and products. Price errors or duplicate event submissions distort revenue, ROAS, and other commercial metrics.
Google Analytics for an online store should be checked after every change to the checkout, CMS, or Data Layer. Template updates can change the data structure even while the GA4 tag itself continues to load.
When analyzing sales, it's advisable to compare Analytics with the CMS or CRM. Minor differences are possible due to accounting rules and user consents, but major discrepancies require technical diagnostics.
How does GA4 work with SPA and AJAX?
Single-page applications and AJAX interfaces require special testing, as content changes aren't always accompanied by a standard HTML document load. Because of this, the standard page view logic may behave differently than on a classic website.
Queries like “ga4 spa”, “spa ga4”, and “ajax google analytics” relate to technical measurement setup. It's especially important to test events after actual user actions, rather than limiting testing to the first time the site is opened.
Why does SPA require a separate check?
In SPAs, the URL and page content can be changed via JavaScript without a full document reload. GA4 can handle browser history changes, but the specific implementation needs to be tested on each project.
The main risk is missed or duplicate page_views. If the same visit is simultaneously recorded by automatic configuration and an additional GTM tag, the pageview statistics will be inflated.
After implementation, you need to navigate through several virtual pages and view the events in DebugView. Each page_view must pass the current page_location and other required parameters.
How to track AJAX actions?
The AJAX request itself usually has no analytical value on its own. What matters most is the result of the action: successfully submitting a form, loading results, adding a product, or completing a calculation.
It's best to send the event after a confirmed successful action, rather than after the click itself. Otherwise, the user might click the button, receive an error, and still be counted as having completed the action.
For complex interfaces, it's convenient to transfer data through the Data Layer and use it in GTM. This scheme separates the business event, the site's technical logic, and sending data to Analytics.
Google Analytics 4 Integrations

GA4 works seamlessly with other Google products and external systems. Integrations are selected based on the project's goals: advertising, SEO, deep data analysis, visualization, or a mobile app.
It's not necessary to connect all services at once. First, you need to determine what data the team will actually use and who is responsible for verifying it.
Google Ads
The GA4 Google Ads link helps you use Analytics data with your advertising account. Once set up, you can manage audiences and linked ad conversions.
The gclid parameter is used in the Google Ads ecosystem to identify ad clicks when configured accordingly. The Google CPC GA4 query is typically associated with the analysis of paid traffic from Google.
When evaluating advertising, it's important to consider the attribution model and the differences between the systems. Don't expect every GA4 figure to match your ad account's.
Google Search Console
Search Console integration is especially useful for SEO. It adds search visibility data to user behavior data on your website.
Search Console answers questions about impressions, clicks, and queries, while GA4 helps you see post-click activity. Together, these data provide a more complete picture of organic traffic.
Before comparing, use the same dates and understand the differences in accounting methods. Even related services may show different values.
BigQuery
BigQuery is used when standard GA4 reports are insufficient and exported data needs to be analyzed. This is especially true for large projects, in-house BI systems, and complex analytical models.
Exporting provides more freedom in query construction, but requires technical expertise. Without a clear event schema, large volumes of raw data quickly become difficult to maintain.
For a small site, BigQuery is usually not needed initially. The first step is to ensure accurate data collection and understandable standard reports.
Looker Studio
Looker Studio is suitable for dashboards where data needs to be presented in a format convenient for the team or client. Multiple metrics and visualizations can be combined into a single report.
A good dashboard answers specific questions rather than displaying every available metric. For SEO, this could be organic users, landing pages, and key events; for advertising, it could be expenses, inquiries, and revenue.
Before building a visualization, you need to check the source data. A beautiful graph won't correct a tag error or a duplicate event.
Android and iOS
GA4 is also used for mobile app analytics. The app ecosystem makes extensive use of Firebase, which is used to configure data collection for Android and iOS.
The event-driven model helps to use common measurement logic for both web and app if the project architecture is well-designed. However, the technical implementation of a mobile app differs from the installation of JavaScript on a website.
Queries like “analytics google android”, “android ga4”, “google analytics ios”, and “ga4 app” are best considered in separate developer documentation if the project requires extensive SDK customization.
How to grant access to Google Analytics?

Collaboration doesn't require sharing your Google account password. You can add a separate user in Analytics and assign them permissions within the account or a specific property.
This approach is convenient for agencies, developers, analysts, and other contractors. Access can be changed or removed without affecting the business owner's account.
Access levels
User permissions depend on the tasks. One specialist may only need to view reports, while another may need to manage property settings or add integrations.
Before granting permissions, it's important to define a specific list of tasks. Full administrative access for simply viewing statistics is usually not necessary.
It's best to set up Google Analytics guest access using a separate user account or a corporate work address. Shared logins complicate access control after a contractor change.
How to add a user?
Adding a user is done through the account or property's access control settings. You need to specify the user's Google account and select the appropriate permission set.
Queries like “give Google Analytics access”, “how to add a user to Google Analytics”, and “how to grant access to Google Analytics” refer to this operation. Once added, the new user logs into Analytics using their own account.
If the invited person doesn't see the property they need, check the address and access level. For a company with multiple properties, it's easy to grant permissions to the wrong project.
What access should I give to the contractor?
For SEO analysis, viewing data and accessing the necessary reports is often sufficient. Setting up integrations, events, or structure may require higher permissions.
It's best to grant the minimum permissions necessary for a specific task. Once the collaboration is complete, any unnecessary access should be removed.
If the contractor also works with GTM, Search Console, or Google Ads, permissions for these systems are granted separately. Access to Analytics alone does not automatically grant access to other services.
Free Google Analytics vs. Google Analytics 360 – What's the Difference?

The standard version of Google Analytics 4 is available to most websites at no additional cost and covers common web analytics needs. For small and medium-sized projects, its capabilities are usually sufficient.
Google Analytics 360 is designed for large organizations with increased requirements for limits, support, and corporate infrastructure. Searches such as “ga360 ga4”, “ga4 360”, and “google analytics 360 what is this” refer specifically to this version.
There's no point in choosing 360 just for the name. First, you need to understand whether the project runs into the limitations of standard GA4 and whether additional corporate terms are required.
In both cases, data quality depends on the implementation of the measurements. The more expensive version does not correct incorrect purchases, duplicate page_views, or chaotic event systems.
Where can I get Google Analytics 4 training?
To learn the service, it's best to combine the official documentation with hands-on practice on a real or test property. The interface and terminology change, so an old Google Analytics video may show menu items that no longer exist.
Google Analytics Academy and Skillshop training provide a structured introduction to the platform. The official Analytics help and Google for Developers section for technical resources are also helpful.
A beginner can move in the following order:
- understand the structure of the account, property and data stream;
- install Google tag and check Realtime yourself;
- study Acquisition, Pages and screens, Events and key events;
- configure one real event via GTM and check it in DebugView;
- connect Search Console or Google Ads if required by the project.
This Google Analytics course is more useful than watching a bunch of lessons without any practical experience. You can experiment using Google's demo properties or your own test site.
Search queries like “Google Analytics Academy in Russian”, “Google Analytics training in Russian”, “Google Analytics 4 course, Google Analytics course for beginners” should be checked against current programs, as the range of lessons and languages changes over time.
Common Mistakes When Working with Google Analytics 4
Most problems start not in reports, but at the data collection stage. If the original event is reported incorrectly, subsequent filters and visualizations will only accurately display erroneous statistics.
One of the most common situations is double-installation of a Google tag. For example, a Google counter is connected via a CMS, but the same Measurement ID is re-triggered from GTM. As a result, a single view can be recorded multiple times.
Other common mistakes:
- an incorrect Measurement ID is used or data is sent to a test property;
- Google Tag Manager changes were saved, but the container remained unpublished;
- for one action, different events are created without a unified naming system;
- key events are marked without prior verification of their actual occurrence;
- e-commerce sends wrong currency, value or duplicate purchase;
- the team tries to find a full list of SEO queries only within GA4;
- after changing a form, SPA or checkout, no one checks the events again;
- the internal activity of employees is mixed with the behavior of ordinary customers;
- Consent Mode and other privacy settings are not taken into account when analyzing changes.
A separate issue arises when comparing data from different systems. CRM, Google Ads, Search Console, and Analytics use different accounting rules, so identical periods don't guarantee identical numbers.
It's best to check your Google Analytics settings after every significant change to your website. This type of monitoring takes less time than restoring several months of statistics with uncertain accuracy.
Google Analytics 4 helps you link website traffic to specific user actions. For basic setup, you need to create a property and data stream, install a Google tag, test data collection, and identify the events that are truly important for your project.
After this, you can work with reports on traffic sources, pages, audiences, and key actions. For SEO, GA4 data should be supplemented with Search Console, and for an online store, with correct e-commerce markup and verified purchase events.
If Google Analytics is already installed, but data is inconsistent, events are duplicated, or some actions are not being recorded, it's best to start with a technical audit of your tags and event schema. Review your current GA4 setup before using its data for SEO, advertising, and website development decisions.


